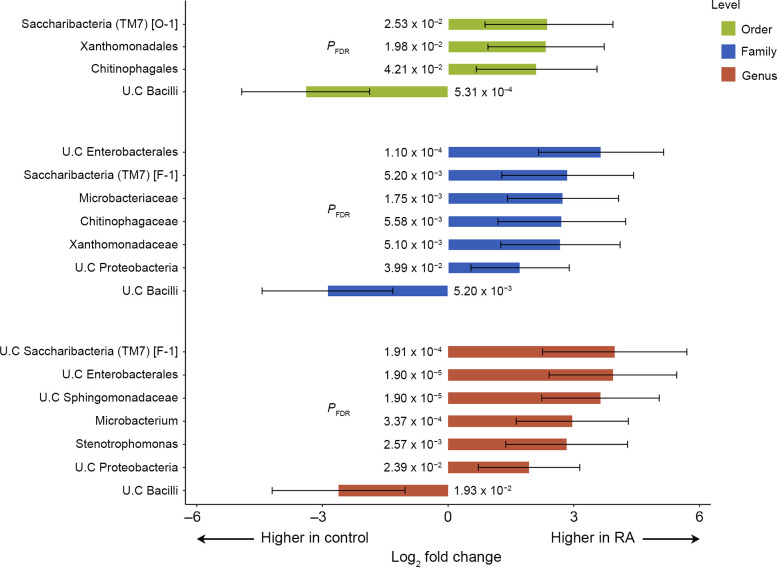
Fig 4. Differential abundance analysis of individual microbial taxa in patients with RA compared to healthy controls.
The bar plot illustrates the significantly differential abundance changes in individual microbial taxa at the order, family, and genus taxonomic levels. Each bar represents a log2-fold change in the mean abundance of a taxon in patients with RA compared to healthy controls, with error bars corresponding to the 95% confidence intervals. BH FDR-corrected P-values for the log2-fold change are provided. Abbreviations: RA, Rheumatoid arthritis; BH FDR, Benjamini-Hochberg false discovery rate.

