Figure 2.
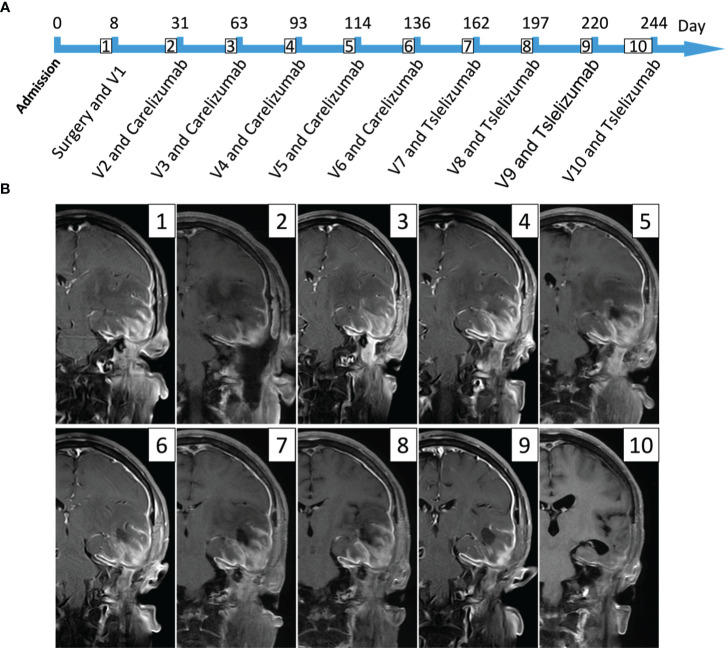
This figure mainly expresses the timeline of the patient’s treatment and the lesion changes in imaging. (A) The patient received a total of one intraoperative oncolytic virus treatment and then nine oncolytic virus and PD-1 inhibitor treatments. The first five times used 110 mg of carelizumab, and the last four times used 200 mg of tislelizumab; the dose of oncolytic virus used was 5 × 10¹¹vp (V represents the number of virus treatments). (B) It mainly shows the changes in the patient’s MRI scans during treatment (T1 enhancement phase); the preoperative images (1) can see the tumor lesion, partly invading the surrounding soft tissues and dura mater; the left temporal lobe and insular edema are very severe. The postoperative MRI shows that the tumor in the left temporal region has been sub-totally removed, but the part that erodes the dura mater and surrounding soft tissues still exists. After using the combined treatment nine times, the last follow-up image (10) can hardly see the enhanced image, and the patient’s symptoms are almost completely relieved.

