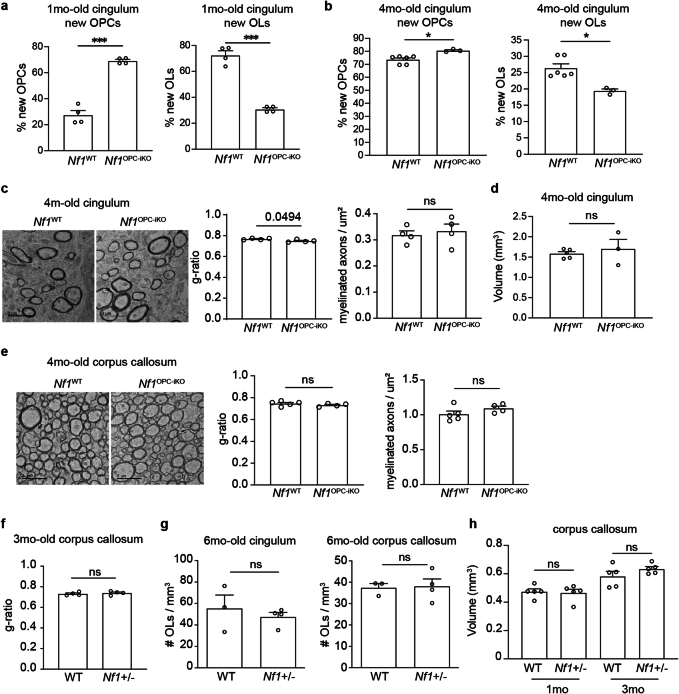
Extended Data Fig. 8. Nf1-mutant mice develop normal baseline oligodendrocyte density and myelination by young adulthood.
(a) Immunohistochemistry performed in the cingulum of 1-month-old Nf1WT and Nf1OPC-iKO mice (tamoxifen injected at P28) revealed that Nf1OPC-iKO mice had an increased percentage of new OPCs (the number of EdU+/Olig2+/PDGFRα+ cells divided by the number of EdU+/Olig2+ cells) and reduced percentage of new OLs (the number of EdU+/Olig2+/PDGFRα- cells divided by the number of EdU+/Olig2+ cells) relative to Nf1WT mice. N = 4 per group. ***, P = 0.0005. Welch’s test. (b) Nf1WT and Nf1OPC-iKO mice received tamoxifen at 13 weeks of age and pulsed with EdU in the drinking water for one week starting at 15 weeks of age. Immunohistochemistry performed at 16 weeks of age revealed that Nf1OPC-iKO mice (N = 3) had an increased percentage of new OPCs (the number of EdU+/Olig2+/PDGFRα+ cells divided by the number of EdU+/Olig2+ cells) and reduced percentage of new OLs (the number of EdU+/Olig2+/PDGFRα- cells divided by the number of EdU+/Olig2+ cells) relative to Nf1WT mice (N = 6). Mann-Whitney test; *, P = 0.0238. (c) Transmission electron microscopy (TEM) analysis of myelin structure in the cingulum of 4-month-old Nf1WT and Nf1OPC-iKO mice revealed similar g-ratios (N = 4 per group) and densities of myelinated axons (N = 4 per group). Welch’s test. (d) Stereological analysis revealed similar cingulum volume between 4-month-old Nf1WT (N = 5) and Nf1OPC-iKO (N = 3) mice. Welch’s test. (e) TEM revealed similar g-ratios and density of myelinated axons in the corpus callosum of 4-month-old Nf1WT (N = 5) and Nf1OPC-iKO (N = 4) mice. Welch’s test. (f) TEM revealed similar g-ratios in the corpus callosum of 3-month-old WT and Nf1+/- mice. N = 4 per group. Welch’s test. (g) Immunohistochemistry revealed a similar density of oligodendrocytes (ASPA+ cells) in the cingulum and corpus callosum of 6-month-old WT (N = 3) and Nf1+/- (N = 4) mice. Welch’s test (cingulum). Mann-Whitney test (corpus callosum). (h) Stereological analysis revealed similar corpus callosum volume between WT and Nf1+/- mice at 1-month and 3-month of age. N = 5 per group. Welch’s test. Data shown as mean ± SEM; each point = one mouse (a-h); two-sided; ns, not significant (P > 0.05). Scale bars, 2 µm.

