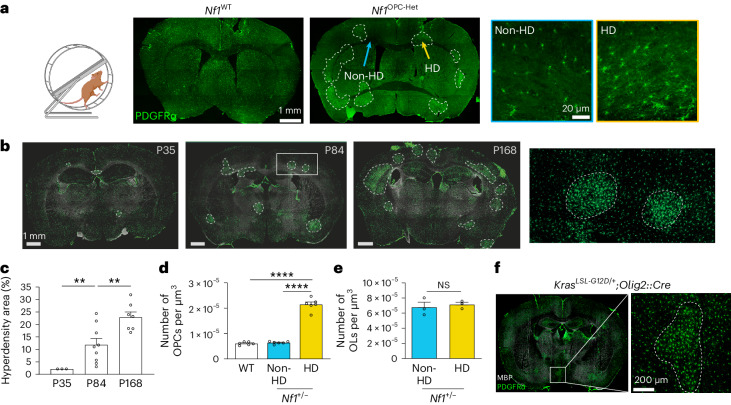
Fig. 3. Monoallelic Nf1 inactivation generates focal OPC hyperdensities with defective experience-dependent oligodendrogenesis.
a, Left: experimental design. CW, complex wheel. Middle: immunohistochemistry of PDGFRα (green) revealed focal OPC hyperdensities (HD) in the Nf1OPC-Het (Nf1+/fl;Pdgfra::Cre) mice. Scale bar, 1 mm. Right: representative non-HD (blue outline) and HD (yellow outline) OPCs (PDGFRα, green). Scale bar, 20 µm. b, PDGFRα immunohistochemistry (green) of Nf1+/− mouse brains at P35, P84 and P168. Inset, two focal OPC hyperdensities and the surrounding nonhyperdensity regions. Scale bar, 1 mm. c, Quantification of b revealed an increased area of focal OPC hyperdensities in Nf1+/− mouse brains at P35, P84 and P168. **P = 0.0092 (P35 versus P84), 0.0089 (P84 versus P168). N = 3, 9 and 7 (left to right). d, Quantification of OPC (PDGFRα+ cells) density in P35 mice revealed increased OPC density within the hyperdensity (HD) areas, relative to nonhyperdensity (non-HD) areas, in Nf1+/− mouse brains and WT mouse brains. N = 6 per group. ****P < 0.001. e, Quantification of OL (ASPA+ cells) density in the cingulum of P184 Nf1+/− mice revealed no differences between hyperdensities (HD) and nonhyperdensity (non-HD) areas. N = 3 per group. Unpaired t-test with Welch’s correction. f, Immunohistochemistry of PDGFRα (green) revealed focal OPC hyperdensities in the brains of KrasLSL-G12D/+;Olig2::Cre mice. Scale bar, 200 µm. Brown–Forsythe ANOVA test with Dunnett’s T3 multiple comparisons (c, F = 20.57; d, F = 216). Data shown as mean ± s.e.m.; each point represents one mouse (c–e); two-sided; NS, not significant (P > 0.05).

