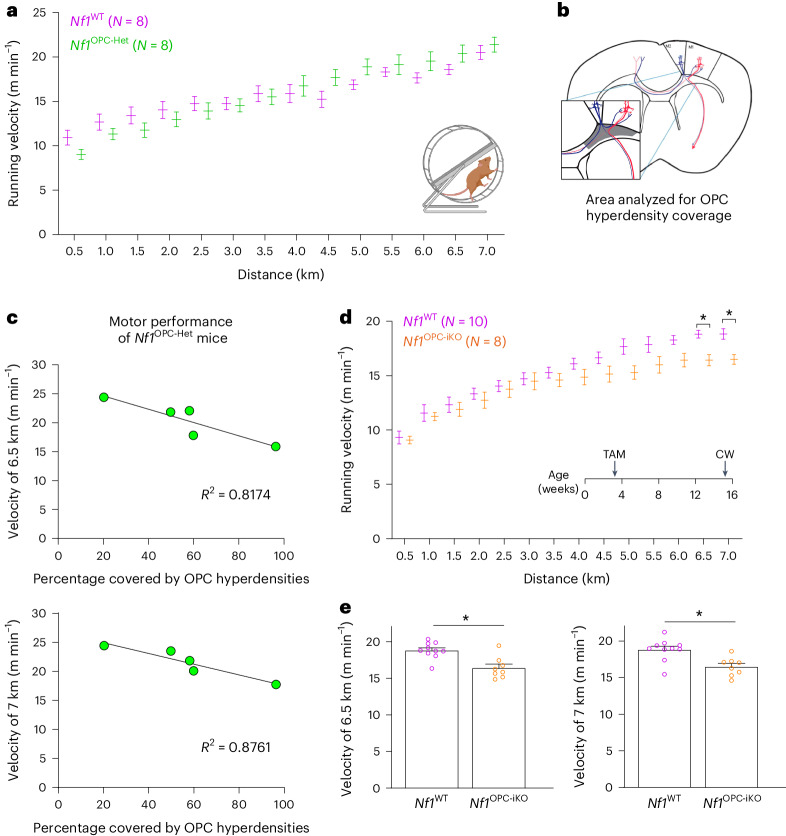
Fig. 6. Nf1 inactivation in OPCs results in motor learning deficits.
a, Nf1OPC-Het (Nf1+/fl;Pdgfra::Cre) mice (green, N = 8) showed a similar motor skill learning curve as Nf1WT mice (magenta, N = 8). Two-way ANOVA with Bonferroni test. Comparisons between Nf1WT and Nf1OPC-iHet mice at each distance are not significantly different (P > 0.05). b, The shaded area represents the cingulum analyzed for the percent focal OPC hyperdensity coverage in c. c, The velocity of Nf1OPC-Het mice at the end of the complex wheel test (6.5 and 7 km) is plotted against the percent area of cingulum covered by focal OPC hyperdensities. There is a negative correlation between the percent area covered by focal OPC hyperdensities and motor performance. Linear regression R2 = 0.8174 (6.5 km) and 0.8761 (7 km). d, Toward the end of the complex wheel test (6.5–7 km, e), Nf1OPC-iKO mice (orange, N = 8) exhibited motor learning deficits relative to the Nf1WT (magenta, N = 10) mice. e, The velocity of individual mice in d at 6.5 and 7 km. Two-way ANOVA with Bonferroni test. *P = 0.0332 (6.5 km) and 0.0372 (7 km). TAM, tamoxifen injection; CW, complex wheel. Data shown as mean ± s.e.m.; each point represents one mouse (c and e); two-sided (a, d and e).

