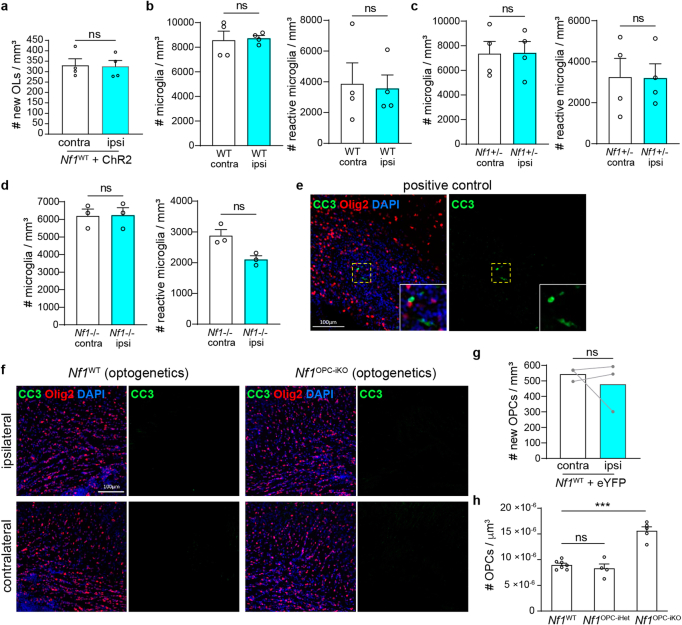
Extended Data Fig. 1. Optogenetic experiment controls.
(a) Immunohistochemistry revealed no change in the density of new oligodendrocytes (EdU+/ASPA+) between the ipsilateral (blue, ipsi) and the contralateral (white, contra) side, during the 3-hour of the optogenetics experiment. Unpaired t test with Welch’s correction; N = 4 in each group. (b-d) Immunohistochemistry of the cingulum revealed no change in the density of microglia (Iba1+ cells) or reactive microglia (CD68+/Iba1+ cells) between the ipsilateral (blue, ipsi) and the contralateral (white, contra) side of Nf1WT (WT, N = 4), Nf1OPC-iHet (Nf1+/-, N = 4) and Nf1OPC-iKO (Nf1-/-, N = 3) mice. Paired t test. (e) Cleaved caspase-3 (CC3) immunohistochemistry in the positive control (cuprizone-induced demyelination) showed staining of CC3+ (green) cells. Scale bar, 100 µm. (f) Immunohistochemistry of the cingulum from Nf1WT and Nf1OPC-iKO mice exposed to optogenetic stimulation revealed few CC3+ cells. Scale bar, 100 µm. (g) Nf1WT mice infected with AAV carrying eYFP did not show changes in the density of new OPCs (EdU+/PDGFRα+) on the ipsilateral (blue, ipsi) side, relative to the contralateral (white, contra) side, of the brain. Mann-Whitney test; N = 3 in each group. (h) The density of total OPCs (PDGFRα+) in the contralateral side of optogenetically manipulated Nf1OPC-iKO (N = 5), but not Nf1OPC-iHet (N = 4), mice is increased relative to the Nf1WT (N = 7) controls. Brown-Forsythe ANOVA test (F = 34.93) with Dunnett’s T3 multiple comparisons. ***, P = 0.0009. Data shown as mean ± SEM; each point = one mouse (a,b,c,d,g,h); two-sided; ns, not significant (P > 0.05).

