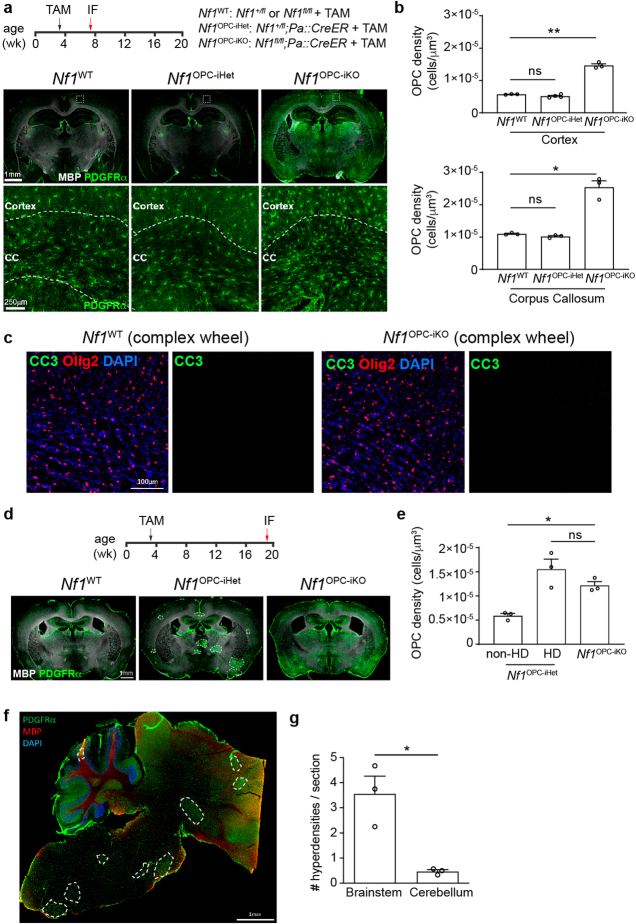
Extended Data Fig. 2. OPC-specific Nf1 biallelic inactivation leads to global OPC hyperdensity, whereas Nf1 monoallelic inactivation leads to focal OPC hyperdensities.
(a, b) Nf1 monoallelic and biallelic inactivation was induced at 3 weeks of age and mouse brains analyzed 4 weeks later by immunofluorescence (IF). Immunohistochemistry revealed increased OPC (PDGFRα+ cells) density in the brains of Nf1OPC-iKO (N = 3), but not Nf1OPC-iHet (N = 3 [corpus callosum], 4 [cortex]), mice relative to the Nf1WT controls (N = 3). Brown-Forsythe ANOVA test (F = 55.06 [corpus callosum], 250.9 [cortex]) with Dunnett’s T3 multiple comparisons; *, P = 0.0299; **, P = 0.0056; Scale bars, 1 mm (top), 250 µm (bottom). (c) Immunohistochemistry of the cingulum from Nf1WT and Nf1OPC-iKO mice exposed to complex wheel testing revealed few CC3+ cells. Scale bar, 100 µm. (d-e) Nf1 monoallelic and biallelic inactivation was induced at 3 weeks of age, and brains analyzed 16 weeks later. PDGFRα immunohistochemistry (green) revealed globally increased OPC density in the brains of Nf1OPC-iKO mice, and focal OPC hyperdensities (dash lines) in Nf1OPC-iHet mice. N = 3 in each group; Brown-Forsythe ANOVA test (F = 13.82) with Dunnett’s T3 multiple comparisons; *, P = 0.0115; Scale bar, 1 mm. (f) Sagittal sections of Nf1+/- mouse brains were immunolabeled with PDGFRα (green) and MBP (red) antibodies. Scale bar, 1 mm. Dashed shapes indicate the focal OPC hyperdensities. (g) The number of focal OPC hyperdensities detected in each brain section from 16-week old Nf1+/- mice. N = 3 per group. Welch’s t test; *, P = 0.0471. Data shown as mean ± SEM; each point = one mouse (b,e,g); two-sided; ns, not significant (P > 0.05).

