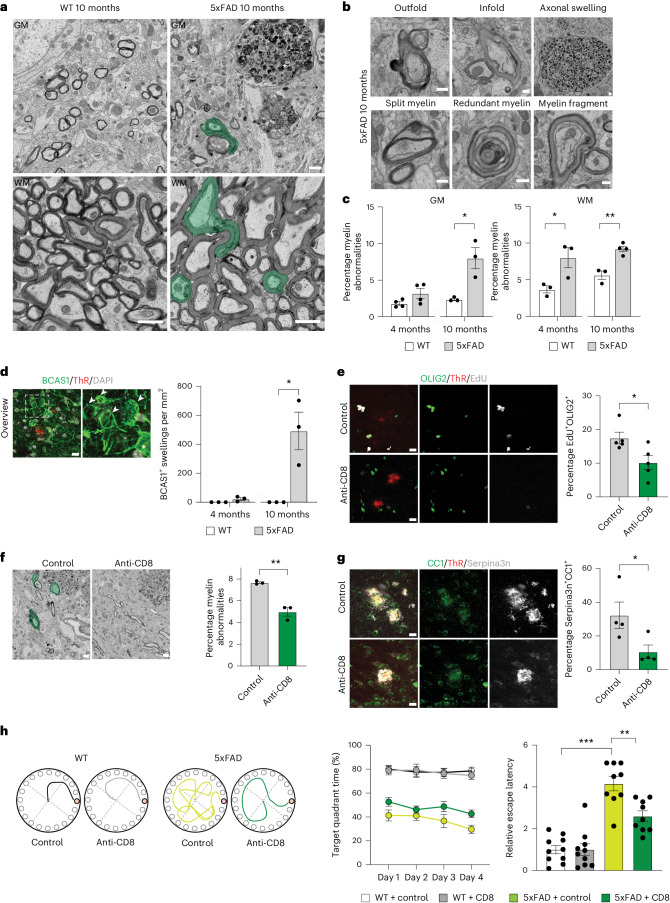
Fig. 1. Oligodendrocyte and myelin damage is ameliorated by CD8+ T cell depletion in 5xFAD mice.
a, SEM images showing myelin abnormalities (green) in WT and 5xFAD mice aged 10 months. The asterisk shows an axonal swelling with thin myelin. b,c, Images (b) and quantification (c) of different myelin abnormalities in 5xFAD brain sections. Unpaired two-sided Student’s t-test for n = 3–4 animals (GM, WT 10 months, 5xFAD 10 months, *P = 0.018; WM, WT 4 months, 5xFAD 4 months, *P = 0.041; WM, WT 10 months, 5xFAD 10 months, **P = 0.002). d, Image of BCAS1+ (green) swellings (shown with white arrowheads) lacking a nucleus (stained with DAPI) in 5xFAD mice aged 10 months. Thiazine red (ThR) indicates plaques. Quantifications of BCAS1+ swellings in 4-month old and 10-month old WT and 5xFAD mice. Unpaired two-sided Student’s t-test for n = 3 animals (WT 10 m, 5xFAD 10 m, *P = 0.019). e, Image and quantification showing the percentage of EdU+ (gray) OLIG2+ (green) cells in the cortex of control or CD8+ T cell-depleted 5xFAD mice. ThR (red) indicates plaques; unpaired two-sided Student’s t-test for n = 5 animals (control, anti-CD8, *P = 0.027). f, SEM images and quantification of myelinated axons with myelin abnormalities (green) in the cortex of control or CD8+ T cell-depleted 5xFAD mice; unpaired Student’s t-test for n = 3 animals (control, anti-CD8, **P = 0.002). g, Image and quantification showing the percentage of Serpina3n+ (gray) CC1+ (green) oligodendrocytes in the cortex of control or CD8+ T cell-depleted 5xFAD mice. ThR (red) indicates plaques. Unpaired two-sided Student’s t-test for n = 4 animals (control, anti-CD8, *P = 0.049). h, Behavior of control or CD8+ T cell-depleted WT and 5xFAD mice in the Barnes maze. Left: Tracing graphs in platform trials in the Barnes maze. Right: Quantification of the target quadrant time (%) on the platform during the training sessions and relative escape latency to the target hole in the probe trial. One-way analysis of variance (ANOVA) with Tukey’s post hoc analysis for n = 9–10 animals (WT control, 5xFAD control, ***P = 0.0000000069; 5xFAD control, 5xFAD anti-CD8, **P = 0.0019). Each point on the graph represents one animal. Data are presented as the mean ± s.e.m. a,f, Scale bar, 1 µm. b, Scale bar, 0.4 µm. d,e,g, Scale bar, 10 µm.

