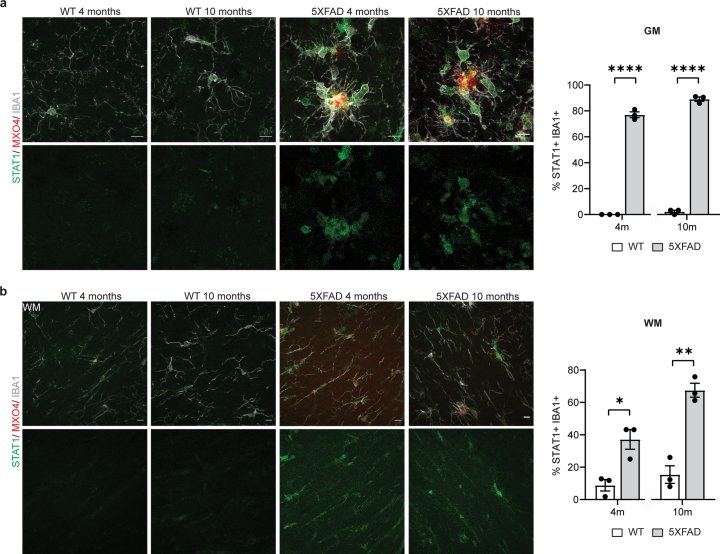
Extended Data Fig. 7. Characterization of STAT1+IBA1+ cells in 5xFAD mice.
a, Representative image showing STAT1+ (green) IBA1+ (grey) microglia in the cortex of WT and 5xFAD mice aged 4 and 10 months. Plaques are stained with Methoxy-X04 (MX04, red). Scale bar 10 µm. Quantifications indicate the percentage of IBA1+ microglia also positive for STAT1. Statistical significance was determined for n = 3 animals using unpaired two-sided Student’s t-test (WT 4 m, 5xFAD 4 m, ****p = 0.000004; WT 10 m, 5xFAD 10 m, ****p = 0.000002). b, Representative image showing STAT1+IBA1+ cells in the corpus callosum of WT and 5xFAD mice aged 4 and 10 months. Plaques are stained with Methoxy-X04 (MX04, red). Scale bar 10 µm. Quantifications indicate the percentage of IBA1+ microglia also positive for STAT1. Statistical significance was determined for n = 3 animals using unpaired two-sided Student’s t-test (WT 4 m, 5xFAD 4 m, *p = 0.015; WT 10 m, 5xFAD 10 m, **p = 0.001). Each point on the graph represents one animal. Data is presented as mean ± SEM.

