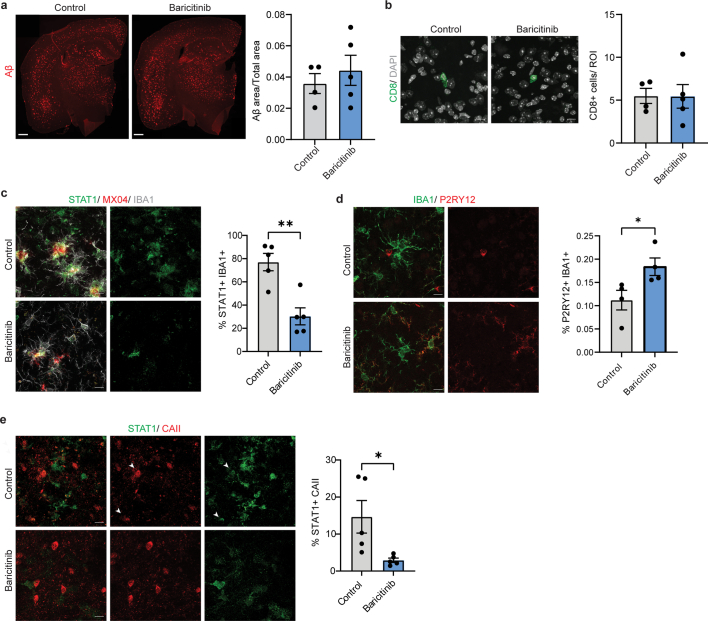
Extended Data Fig. 9. Baricitinib treatment results in no change in amyloid plaque load and CD8+ T cell numbers.
a, Representative image showing Aβ plaque load (red) in 9 months old control and baricitinib treated mice. Quantifications indicate proportion of Aβ positive area normalised to total area in the cortex. Statistical significance was determined for n = 4-5 animals using unpaired Student’s t-test. b, Representative image showing CD8+ T cells (green) in the cortex of control and baricitinib treated mice (9 month-old). Scale bar, 10 µm. Quantifications indicate the number of CD8+ T cells in the cortex. Statistical significance was determined for n = 4-5 animals using unpaired Student’s t-test. c, Representative image showing STAT1+ (green) IBA1+ (grey) cells in control and baricitinib treated mice (7.5 months old). Plaques are stained with Methoxy-X04 (MX04, red). Scale bar, 10 µm. Quantifications indicate percentage of IBA1+ cells also positive for STAT1. Statistical significance was determined for n = 5 animals using unpaired two-sided Student’s t-test (control,baricitinib, **p = 0.002). d, Representative image showing P2RY12+ (red) IBA1+ (green) cells in the cortex of control and baricitinib treated mice (7.5 month-old). Scale bar, 10 µm. Quantifications indicate percentage of IBA1+ cells also positive for P2RY12. Statistical significance was determined for n = 4 animals using unpaired two-sided Student’s t-test (Control, Baricitinib, *p = 0.04). e, Representative image showing STAT1+ (green) CAII+ (red) oligodendrocytes in the cortex of control and baricitinib treated mice (7.5 month-old). Scale bar, 10 µm. Quantifications indicate percentage of CAII+ cells also positive for STAT1. Statistical significance was determined for n = 5 animals using unpaired two-sided Student’s t-test (control, baricitinib, *p = 0.0296). Each point on the graph represents one animal. Data is presented as mean ± SEM.

