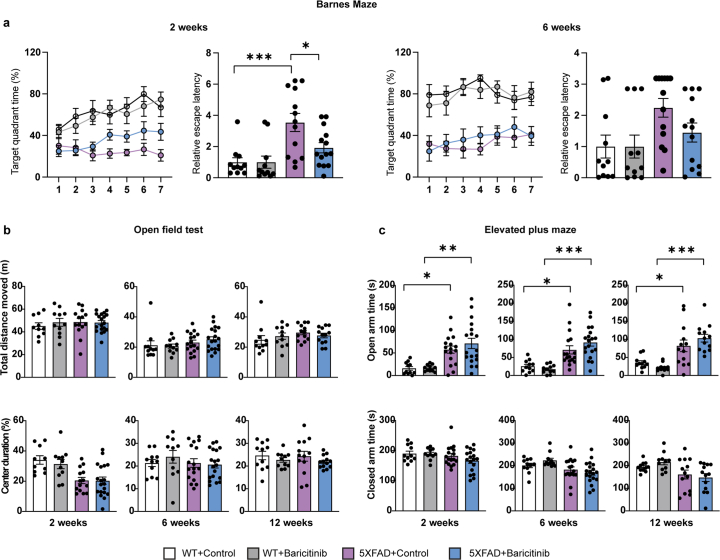
Extended Data Fig. 10. Effects of baricitinib treatment on behavior in 5xFAD mice.
Behavior of 5xFAD mice in Barnes Maze following 2 weeks and 6 weeks of treatment with baricitinib. Quantification of the target quadrant time (%) on the platform during the training sessions and relative escape latency to the target hole in probe trial. Statistical significance was evaluated for n = 11–13 animals by one-way ANOVA followed by Tukey’s post hoc analysis using paired t-test (Relative escape latency, 2 weeks, WT control, 5xFAD control, ***p = 0.0007; Relative escape latency, 2 weeks, 5xFAD control, 5xFAD baricitinib, *p = 0.0321). b, Behavior of 5xFAD mice in an Open Field test following 2 weeks, 6 weeks and 12 weeks of treatment with baricitinib. Quantification of distance travelled on the platform (upper panel) and the percentage of time spent in center (lower panel). Statistical significance was evaluated for n = 11–13 animals by one-way ANOVA followed by Tukey’s post hoc analysis using paired t-test. c, Behavior of 5xFAD mice in an Elevated Plus Maze test following 2 weeks, 6 weeks and 12 weeks of treatment with baricitinib. Quantification of time spent in open arms (upper panel) and the time spent in close arms (lower panel). Statistical significance was evaluated for n = 11–13 animals by one-way ANOVA followed by Tukey’s post hoc analysis (2 weeks, WT control, 5xFAD control, *p = 0.0115; 2 weeks, WT baricitinib, 5xFAD baricitinib, **0.0004; 6 weeks, WT Control, 5xFAD Control, *p = 0.0125; 6 weeks, WT baricitinib, 5xFAD baricitinib, ***p = 0.00001283; 12 weeks, WT Control, 5xFAD Control, *p = 0.02; 12 weeks, WT baricitinib, 5xFAD baricitinib, ***p = 0.00002062). Each point on the graph represents one animal. Data is presented as mean ± SEM.

