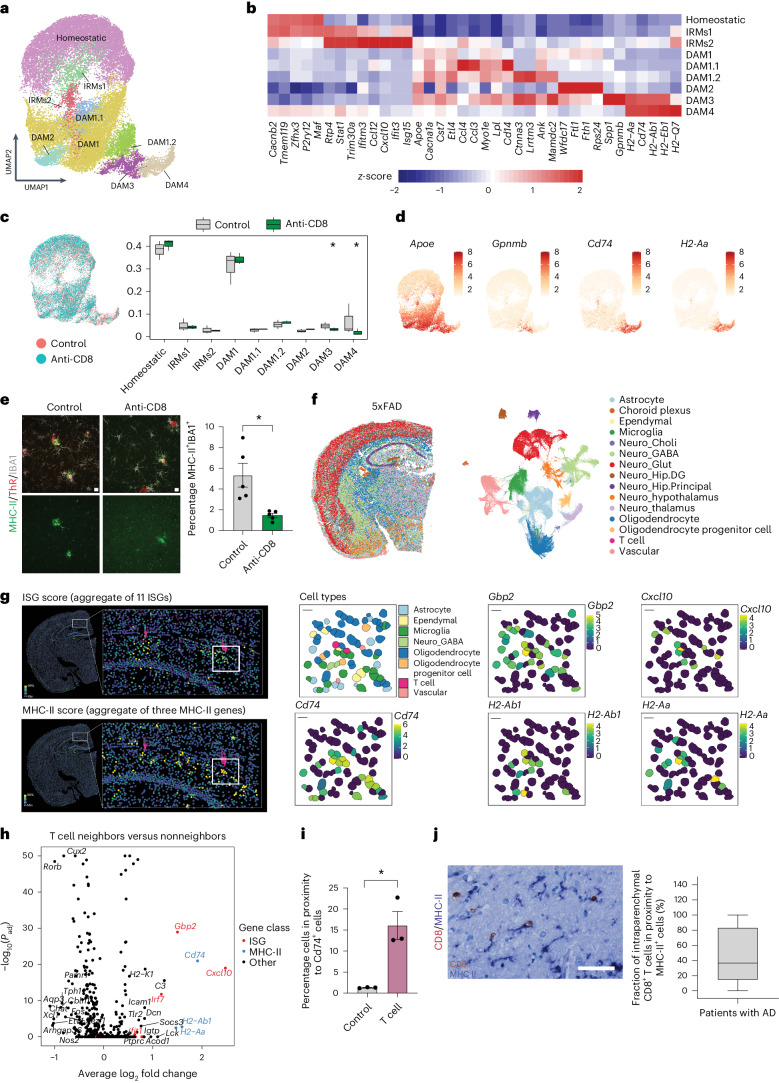
Fig. 2. CD8+-mediated microglial activation in 5xFAD mice.
a, UMAP plot of microglia, colored according to the identified populations. b, Heatmaps of scaled average expression of selected marker genes of microglial populations. c, Left: UMAP plots of microglia. Right: Proportions of different microglial populations in control (gray) or CD8+ T cell-depleted (green) 5xFAD mice. The central line represents median, the boxes the upper and lower quartiles of the proportions, and the whiskers show the full range of all populations. Asterisks indicate statistical significance for n = 3 animals (using scCODA). Statistical significance was determined for n = 3 animals using scCODA. d, UMAP plots of microglia colored according to the expression of selected gene markers. e, Image and quantification showing the percentage of MHC-II+ (green) IBA1+ (gray) cells in the cortex of control or CD8+ T cell-depleted 5xFAD mice. ThR (red) indicates plaques. Unpaired two-sided Student’s t-test for n = 5 animals (control, anti-CD8, *P = 0.010). Data are presented as the mean ± s.e.m. f, UMAP embedding and spatial plots of single-cell transcriptional profiles measured using MERFISH. Cells are colored according to the major cell type. n = 306,537 segmented single cells from five brain sections from n = 3, 9.5-month-old 5xFAD animals. g, Left: MERFISH spatial plot showing the values of ISG (top) and the MHC-II (bottom) expression score. The arrows in the zoom-in show the positions of T cells. Right: Plots show the cell type identities and expression of selected ISG and MHC-II genes. h, Volcano plot of differential gene expression between 50 nearest neighbors of T cells and remaining cells. Bonferroni-adjusted P values from a Wilcoxon rank-sum test are shown. i, Quantification of Cd74+ neighboring cells in proximity to control and T cells. Unpaired two-sided Student’s t-test (control, T cell, *P = 0.011). Data are presented as the mean ± s.e.m. Fifty neighboring cells each were analyzed for a total of 93 CD8+ T cells and 5,000 random cells. j, IHC of human hippocampal sections from 14 patients with AD showed CD8+ T cells (brown) in contact with MHC-II+ myeloid cells (blue). The box plot shows the percentage of CD8+ T cells in contact (<50 µm) with MHC-II+ cells in patients with AD (ABC score > 1). The central line represents the median, the boxes the upper and lower quartiles and the whiskers show the full range of the data. e, Scale bar, 10 µm. j, Scale bar, 50 µm.

