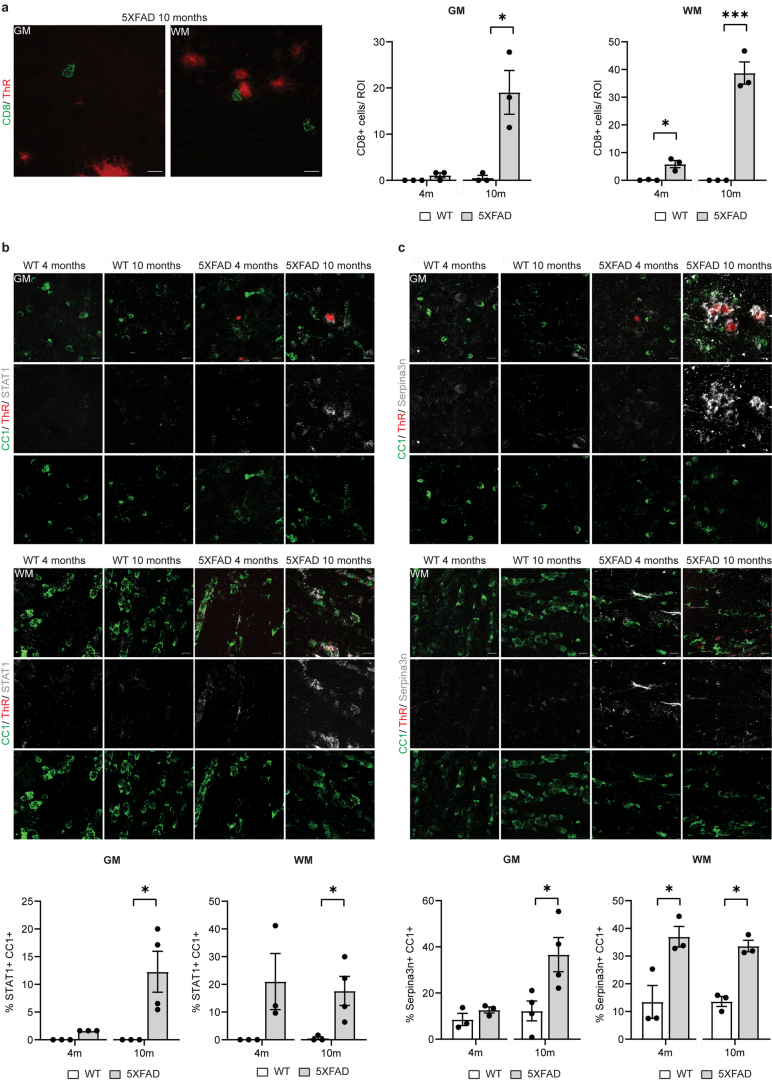
Extended Data Fig. 1. Characterization of CD8+ T cells and disease-associated and interferon-responsive oligodendrocyte states in 5xFAD mice.
a, Representative image showing CD8+ T-cells (green) in the cortex and corpus callosum of 5xFAD mice aged 10 months. Plaques are stained with Thiazine Red (ThR, red). Scale bar, 10 µm. Quantifications indicate the number of CD8+ T cells. Statistical significance was determined for n = 3 animals using unpaired two-sided Student’s t-test (GM, WT 10 m, 5xFAD 10 m, *p = 0.017; WM, WT 4 m, 5XFAD 4 m, *p = 0.011; WM, WT 10 m, 5xFAD 10 m, ***p = 0.0006). b, Representative image showing STAT1+ (grey) CC1+ oligodendrocytes (green) in the cortex (upper panel) and corpus callosum (lower panel) of WT and 5xFAD mice aged 4 and10 months. Plaques are stained with Thiazine Red (ThR, red). Scale bar, 10 µm. Quantifications indicate the percentage of CC1+ oligodendrocytes also positive for STAT1. Statistical significance was determined for n = 3-4 animals using unpaired two-sided Student’s t-test (GM, WT 10 m, 5xFAD 10 m, *p = 0.037; WM, WT 10 m, 5xFAD 10 m, *p = 0.040). c, Representative image showing Serpina3n+ (grey) CC1+ oligodendrocytes (green) in the cortex (upper panel) and corpus callosum (lower panel) of WT and 5xFAD mice aged 4 and10 months. Plaques are stained with Thiazine Red (ThR, red). Scale bar 10 µm. Quantifications indicate the percentage of CC1+ oligodendrocytes also positive for Serpina3n. Statistical significance was determined for n = 3-4 animals using unpaired two-sided Student’s t-test (GM, WT 10 m, 5xFAD 10 m, *p = 0.029; WM, WT 4 m, 5XFAD 4 m, *p = 0.028; WM, WT 10 m, 5xFAD 10 m, *p = 0.001). Each point on the graph represents one animal. Data is presented as mean ± SEM.

