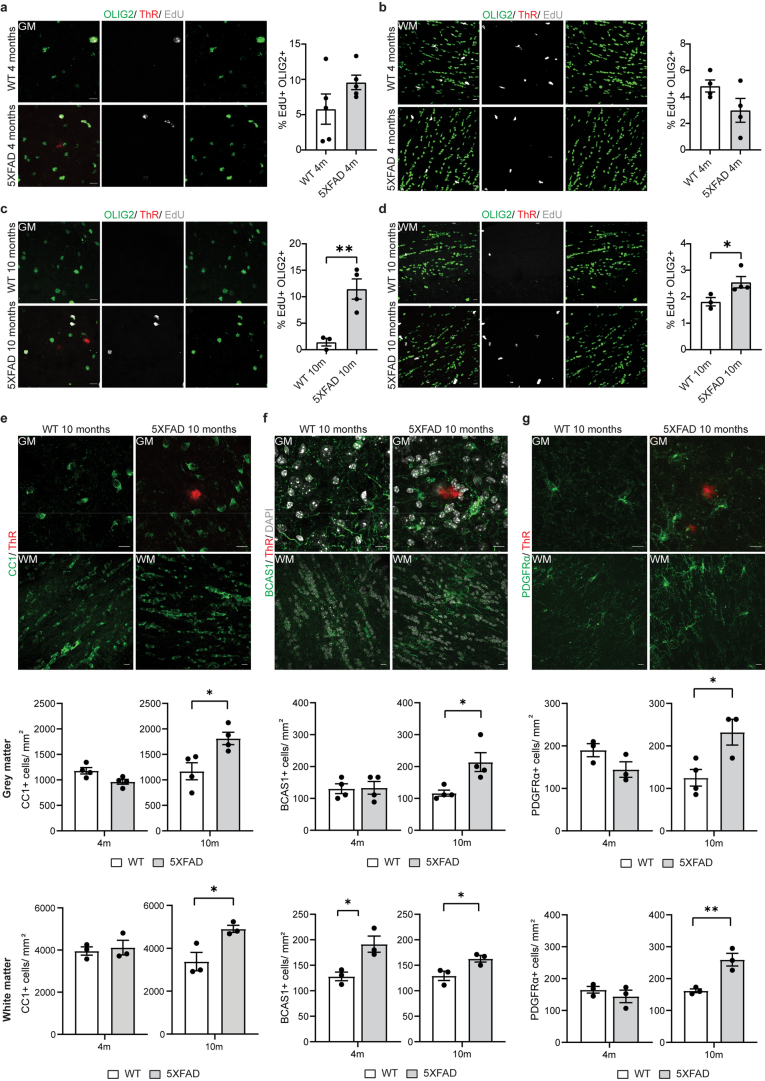
Extended Data Fig. 2. Evidence of increased oligodendrocyte proliferation in 5xFAD mice.
a-d, Representative image and quantification showing percentage of EdU+ (grey) OLIG2+ (green) cells in the cortex and corpus callosum of WT and 5xFAD mice aged 4 and 10 months. Plaques are stained with Thiazine Red (ThR, red). Scale bar, 10 µm. Statistical significance was determined for n = 3-4 animals using unpaired two-sided Student’s t-test (GM, WT 10 m, 5xFAD 10 m, **p = 0.0079; WM, WT 10 m, 5xFAD 10 m, *p = 0.049). e, Representative image and quantification showing number of CC1+ (green) oligodendrocytes in the cortex and corpus callosum of WT and 5xFAD mice aged 4 and 10 months. Plaques are stained with Thiazine Red (ThR, red). Scale bar 10 µm. Statistical significance was determined for n = 3-4 animals using unpaired two-sided Student’s t-test (GM, WT 10 m, 5xFAD 10 m, *p = 0.020; WM, WT 10 m, 5xFAD 10 m, n = 3 animals, *p = 0.029). f, Representative image and quantification showing number of BCAS1+ (green) oligodendrocytes in the cortex and corpus callosum of WT and 5xFAD mice aged 4 and 10 months. Plaques are stained with Thiazine Red (ThR, red). Scale bar, 10 µm. Statistical significance was determined for n = 3-4 animals using unpaired two-sided Student’s t-test (GM, WT 10 m, 5xFAD 10 m, *p = 0.020; WM, WT 4 m, 5xFAD 4 m, *p = 0.024; WM WT 10 m, 5xFAD 10 m, *p = 0.039). g, Representative image and quantification showing number of PDGFRα+ (green) oligodendrocyte precursor cells in the cortex and corpus callosum (lower panel) of WT and 5xFAD mice aged 4 and 10 months. Plaques are stained with Thiazine Red (ThR, red). Scale bar 10 µm. Statistical significance was determined for n = 3-4 animals using unpaired two-sided Student’s t-test (GM, WT 10 m, 5xFAD 10 m, *p = 0.026; WM, WT 10 m, 5xFAD 10 m, **p = 0.009). Each point on the graph represents one animal. Data is presented as mean ± SEM.

