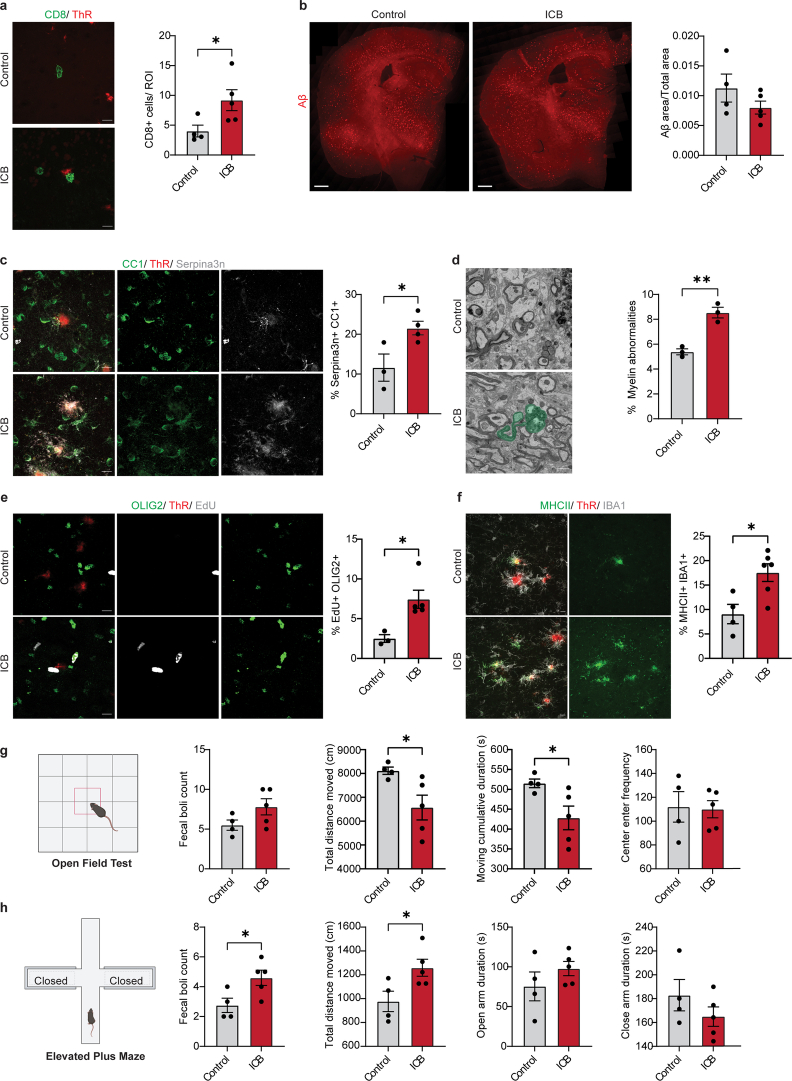
Extended Data Fig. 4. Treatment with immune checkpoint blockage exacerbates oligodendrocyte and myelin damage in 5xFAD mice.
a, Image and quantification showing number of CD8+ T cells (green) in the cortex of control or anti-PD1 and CTLA4 (ICB) treated 5xFAD mice. Plaques are stained with Thiazine Red (ThR, red). Scale bar, 10 µm. Statistical significance was determined for n = 4-5 animals using unpaired two-sided Student’s t-test (control, ICB, *p = 0.048). b, Image and quantification showing Aβ plaque load (red) normalized to total area in the cortex for control or anti-PD1 and CTLA4 (ICB) treated 5xFAD mice. Scale bar, 500 µm. Statistical significance was determined for n = 4-5 animals using unpaired Student’s t-test. c, Representative image and quantification showing percentage of Serpina3n+ (grey) CC1+ (green) oligodendrocytes in the cortex of control or anti-PD1 and CTLA4 (ICB) treated 5xFAD mice. Plaques are stained with Thiazine Red (ThR, red). Scale bar, 10 µm. Statistical significance was determined for n = 3-4 animals using unpaired two-sided Student’s t-test (control, ICB, *p = 0.036). d, SEM images and quantification of myelinated axons with myelin abnormalities (green) in the cortex of control or anti-PD1 and CTLA4 (ICB) treated 5xFAD mice. Statistical significance was determined for n = 3 animals using unpaired two-sided Student’s t-test (control, ICB, *p = 0.003). e, Image and quantification showing percentage of EdU+ (grey) OLIG2+ (green) cells in the cortex of control or anti-PD1 and CTLA4 (ICB) treated 5xFAD mice. Plaques are stained with Thiazine Red (ThR, red). Scale bar, 10 µm. Statistical significance was determined for n = 3-5 animals using unpaired two-sided Student’s t-test (control, ICB, *p = 0.019). f, Image and quantification indicating percentage of MHCII+ (green) IBA1+ (grey) cells in the cortex of control or anti-PD1 and CTLA4 (ICB) treated 5xFAD mice. Plaques are stained with Thiazine Red (ThR, red). Scale bar, 10 µm. Statistical significance was determined for n = 4-6 animals using unpaired two-sided Student’s t-test (control, ICB, *p = 0.015). g, Behavior of control or anti-PD1 and CTLA4 (ICB) treated 5xFAD mice in an open-field test. Quantifications indicate fecal boli count, total distance travelled, frequency to enter the center and cumulative time spent in the center. Statistical significance was determined for n = 4-5 animals using unpaired Student’s t-test (Distance traveled, *p = 0.037; Center enter frequency, *p = 0.041; Cumulative duration in center, *p = 0.014). h, Behavior of control or anti-PD1 and CTLA4 (ICB) treated 5xFAD mice in an elevated plus maze test. Quantifications indicate fecal boli count, total distance travelled, total time spent in the open arms and closed arms. Statistical significance was determined for n = 4-5 animals using unpaired Student’s t-test (Fecal boli count, *p = 0.036; Distance traveled, *p = 0.037). Each point on the graph represents one animal. Data is presented as mean ± SEM.

