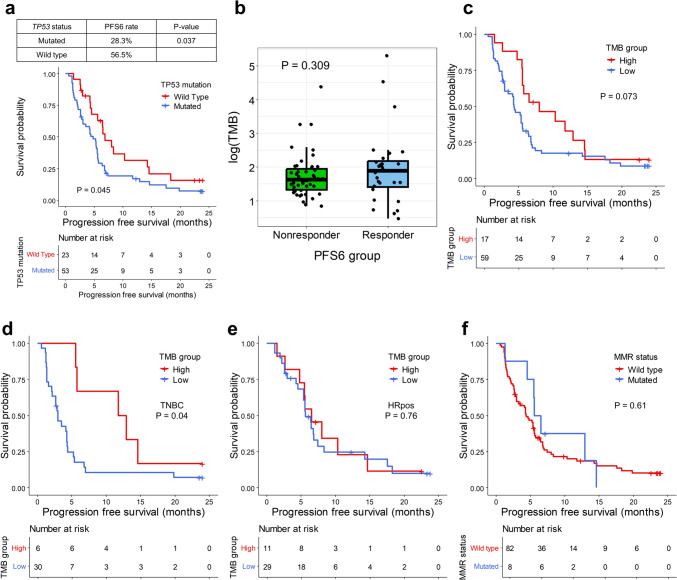
Fig. 1.
Tumor mutation burden and efficacy. a Kaplan–Meier curves showing the progression-free survival (PFS) according to TP53 mutation status. The red line represents the mutant group, and the blue line denotes the wild-type group. Censored data are marked with vertical segments. The risk table is shown below the curves; the log-rank p value is shown. The right table presents the PFS6 rate according to TP53 mutation status. b Box plots illustrate the log value of tumor mutation burden (TMB) according to the PFS6 group; each dot represents a single patient. The p value is shown. c Kaplan–Meier curves showing the PFS according to TMB-high or TMB-low status. The red line represents the TMB-high group, and the blue line indicates the TMB-low group. d, e The Kaplan–Meier curves show the PFS according to TMB-high or TMB-low among TNBC and HRpos patients, respectively. f The Kaplan–Meier curves show the PFS according to MMR status. Censored data are marked with vertical segments. The risk table is shown below the curves; the log-rank p value is shown. Patients who achieved PFS ≥ 6 months were defined as PFS6-responders and otherwise as PFS6-nonresponders

