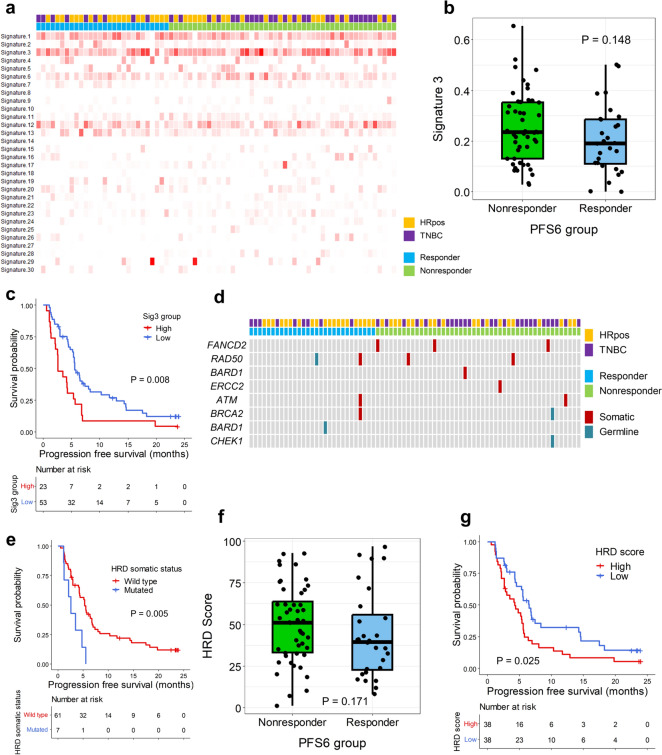
Fig. 2.
Homologous recombination deficiency and efficacy. a Heatmap showing the signature proportions in each patient. Each column represents a patient, and each row represents a mutational signature. On the upper side, each patient is marked according to the tumor subtype and the PFS6 group as the legend. In the heatmap, the degree of redness correlates with the proportion of the signature. b Box plots showing the proportion of signature 3 according to the PFS6 group. Each dot represents a patient. The p value is shown. c Kaplan–Meier curves showing the progression-free survival (PFS) according to high signature 3 or low signature 3. The red line represents the high signature 3 group, and the blue line denotes the low signature 3 group. Censored data are marked with vertical segments. The risk table is shown below the curves; the log-rank p value is shown. d Landscape plot showing the HRD-related gene mutation status in patients. Each column represents a patient, and each row represents a gene. On the upper side, each patient is marked according to the tumor subtype and the PFS6 group as the legend. The columns are ordered left to right by PFS from the longest to the shortest. The red marks indicate patients harboring somatic gene mutations, while the grey marks indicate patients harboring germline gene mutations. e Kaplan–Meier curves show the progression-free survival (PFS) according to HRD-related gene mutation status. The red line represents patients with a somatic mutation, and the blue line represents those without a somatic mutation in the HRD-related genes. Censored data are marked with vertical segments. The risk table is shown below the curves. The log-rank p value is shown. f Box plots showing the HRD score according to the PFS6 group. Each dot represents a patient; the p value is shown. g Kaplan–Meier curves showing the PFS according to HRD scores. The red line represents the high HRD score group, and the blue line indicates the low HRD score group. Censored data are marked with vertical segments. The risk table is shown below the curves; the log-rank p value is shown. Patients who achieved PFS ≥ 6 months were defined as PFS6-responders and otherwise as PFS6-nonresponders

