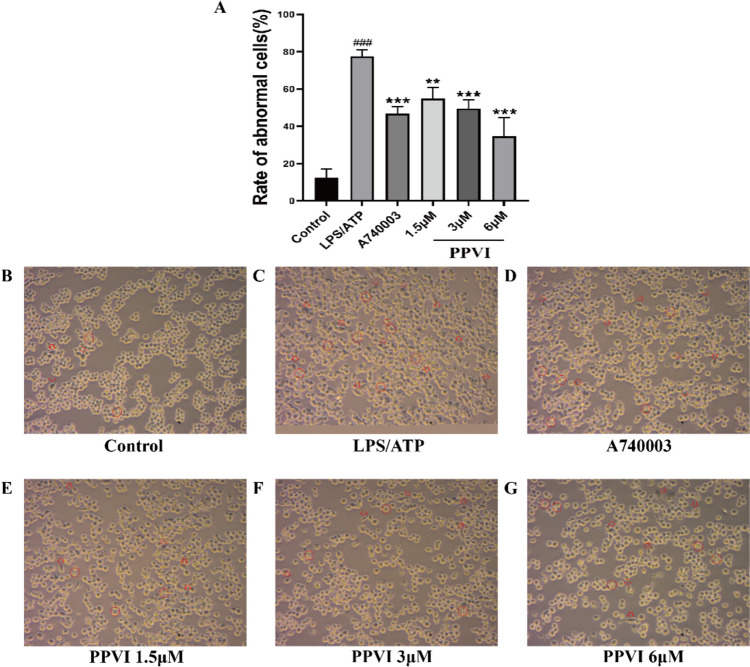
Fig. 10.
The effect of PPVI pre-treated for 1 h on the cell morphology of the LPS/ATP-induced RAW264.7 cell (n = 3). Red arrows indicate changes in cell morphology, and red circles indicate vacuolation and cell membrane rupture. Each group was visualized by an ordinary light microscope (× 400 magnification). Values represent average ± S.D. Significant differences among different groups are indicated as ###p < 0.001 vs. Control; **p < 0.01, ***p < 0.001 vs. LPS/ATP group

