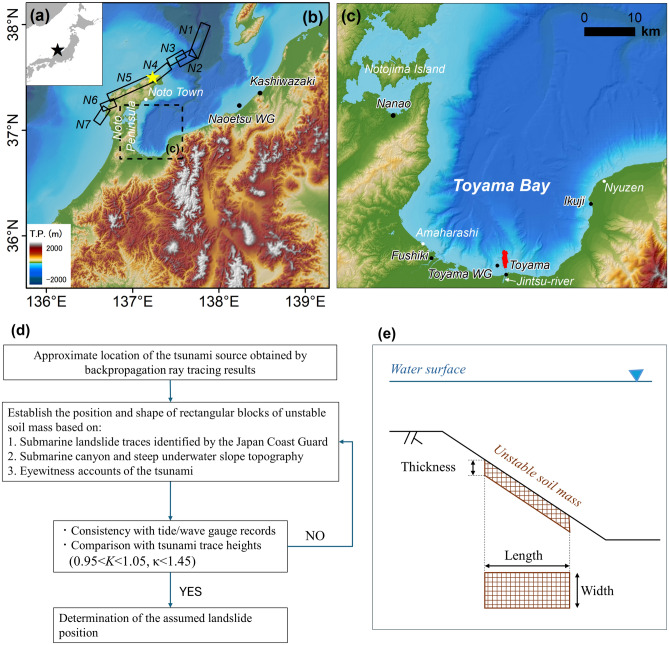
Figure 1.
(a) Epicenter of the 2024 Noto Peninsula earthquake. (b) Study area. Rectangles (NT2–NT9) indicating the locations of the faults in the model by Fujii & Stake1. The star denotes the earthquake epicenter. (c) Map of Toyama Bay. The black dots represent the tide or wave gauge stations. The red shaded area near the Toyama tide gauge station indicates the landslide area detected by the Japan Coast Guard. (d) Flowchart of submarine landslide modeling. (e) Schematic diagram of assumed rectangular blocks of an unstable soil mass.

