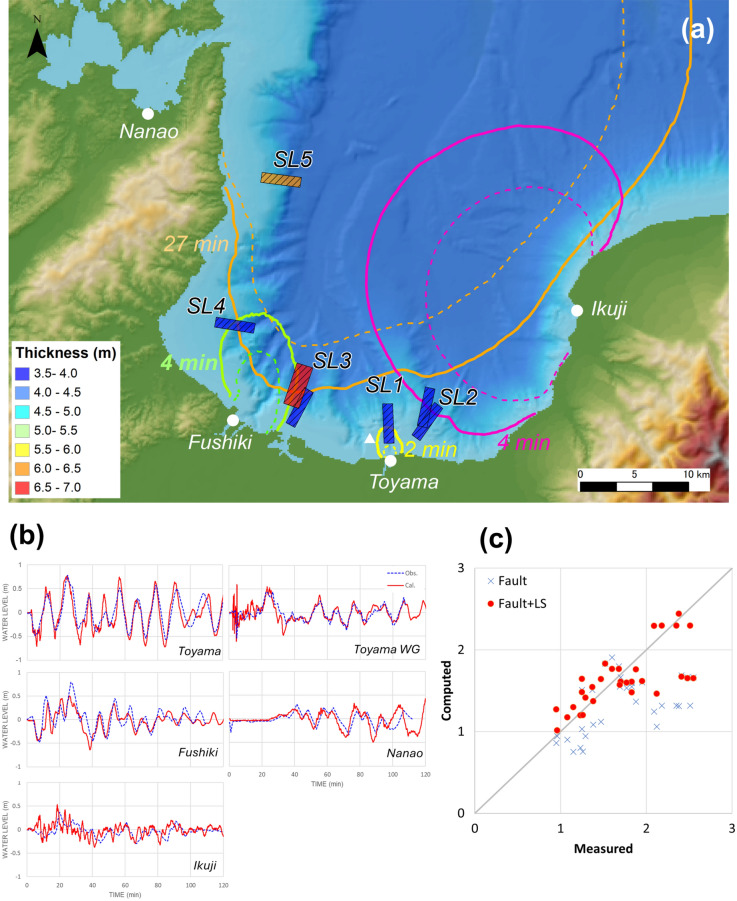
Figure 3.
(a) Backpropagation ray tracing map. The solid lines indicate the wave front when the tsunami arrived, while the dotted lines represent the wave fronts one minute before the tsunami arrived. The yellow, green, orange and pink lines indicate the wave fronts determined from the data from the Toyama, Fushiki, Nanao and Ikuji tide gauge stations, respectively. The triangle indicates the Toyama wave gauge station. The rectangles denote the assumed positions of the submarine landslides. Comparison of (b) the observed tsunami waveforms and (c) tsunami trace heights with the computed results.

