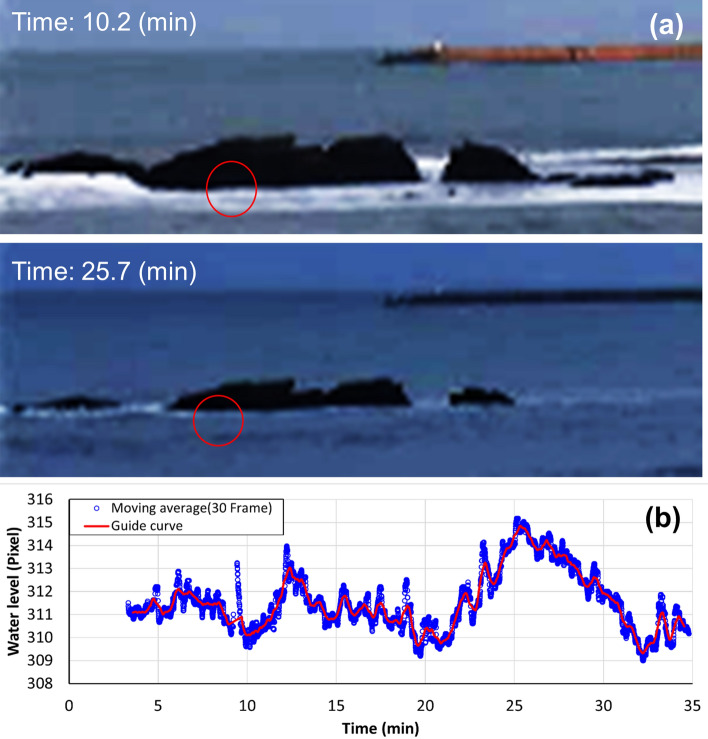
Figure 4.
(a) Snapshots of the images after tone adjustment captured at the Amaharashi coast (provided by the Takaoka cable network). The red circle indicates the position of water surface extraction. At this location, it is possible to clearly extract the boundary between the rocks and the water surface. (b) Water surface fluctuations at each frame extracted from the images. The vertical axis indicates the pixel position of the water level from the bottom of the image. The blue dots represent values smoothed with a moving average of 30 frames. The red line represents a guide curve obtained by smoothing the values of the blue dots with a 30-s moving average. The spike at 9 min is due to the influence of aftershock shaking on the video frame.

