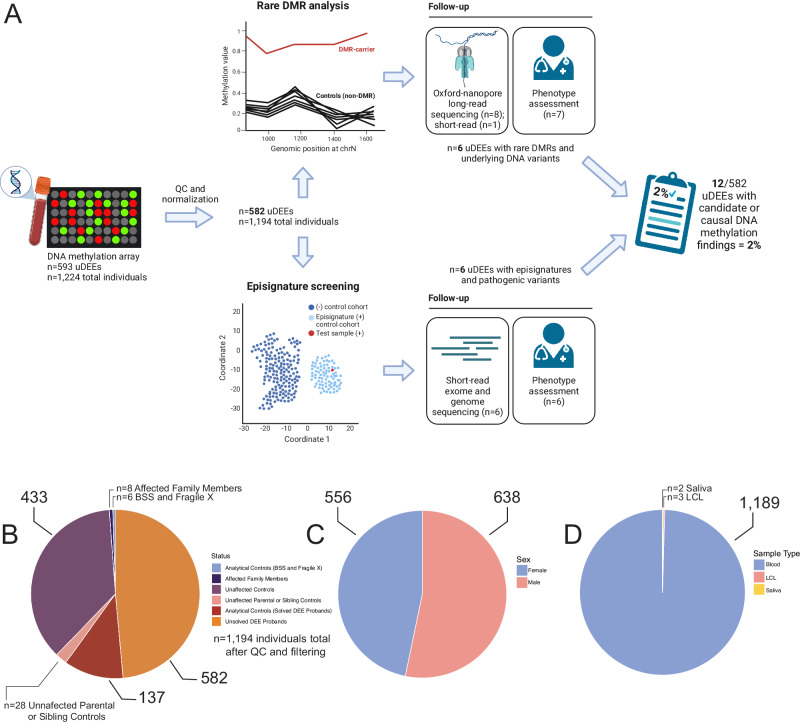
Fig. 1. Description of the DNA methylation analysis and features of the study cohort.
A Flowchart displaying filtering of samples after quality control (QC) and normalization, analysis pipeline for detecting rare DMRs and episignatures, and narrowing down DNA methylation candidates for this study. B Breakdown of the cohort after QC and normalization (n = 1194) containing individuals with genetically unsolved DEEs (uDEEs, n = 582), unaffected controls (n = 461), analytical controls (n = 143), and affected family members (n = 8). C Number of males (n = 638) versus females (n = 556). D Sample type as blood (n = 1189) versus other tissue types (n = 5). Figure 1A was created with BioRender.com and released under a Creative Commons Attribution-Non-Commercial-Noderivs 4.0 International License (CC-BY-NC-ND).

