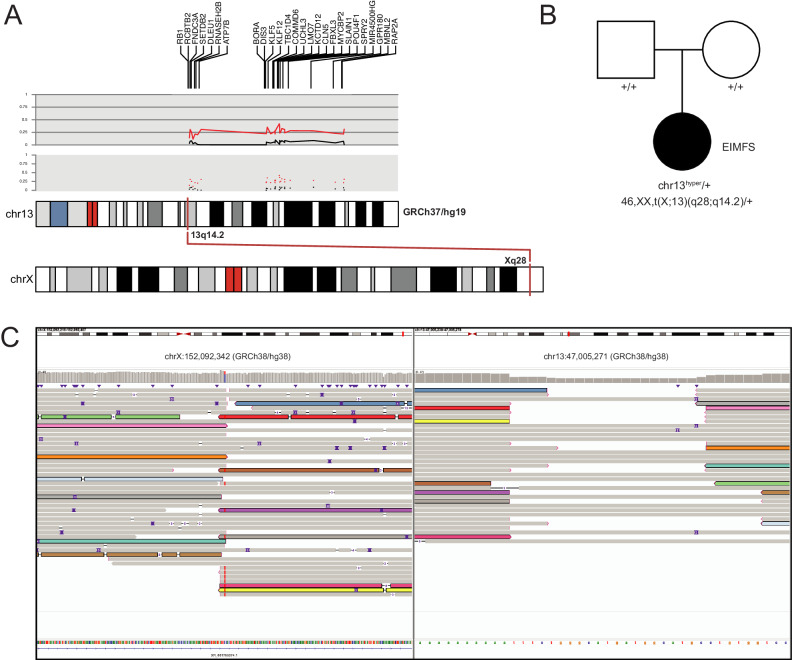
Fig. 2. Rare outlier DMR analysis identifies chromosomal hypermethylation caused by X;13 translocation.
A Graphical representation of chr13 rare hypermethylation events in a proband with uDEE. The upper portion of the track displays the genes on chr13 for which hypermethylation events were called. The two grey panels (upper=line, lower=dot) depict β-values for the average of the proband’s array replicates (red) and the average of the parents’ array data (black) for a representative probe within each DMR (n = 26). Subtle hypermethylation hovering around ~ 25% can be seen for the proband compared to the parents. The lower track shows chromosomal locations of the X;13 translocation. B Pedigree showing that chr13 hypermethylation events and the X;13 translocation occurred de novo. C IGV view of ONT LRS data for chrX (left) and chr13 (right). Some, but not all, reads spanning the translocation are colored to show that they span the breakpoint. Karyotype plots, as shown in Fig. 2A and others throughout the manuscript, were created using the R package karyoploteR98.

