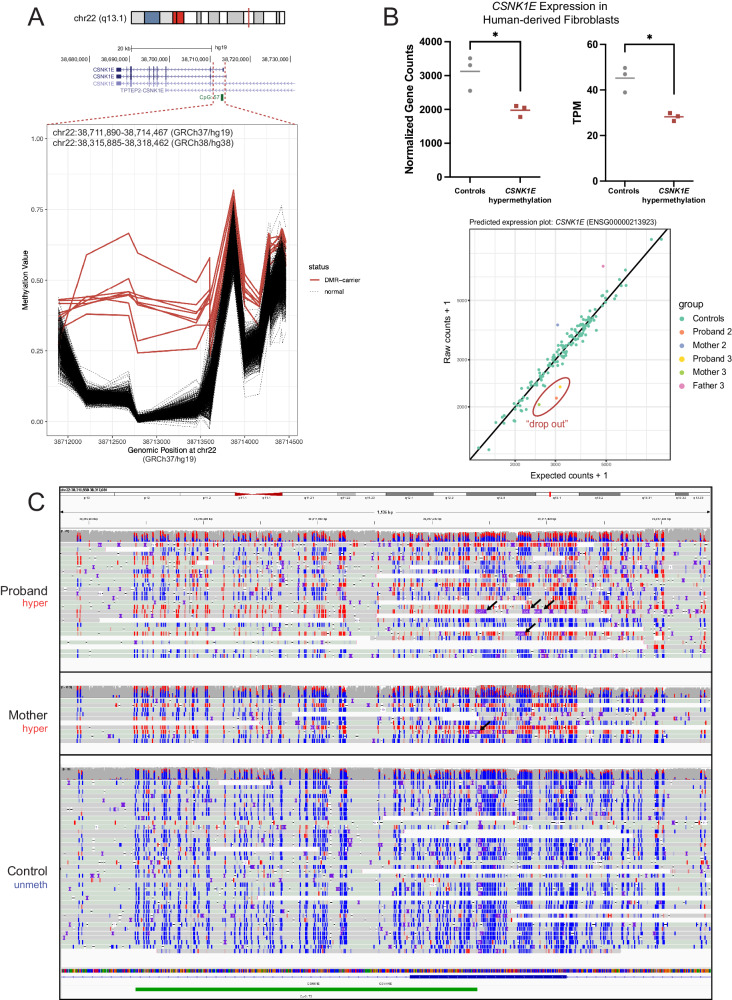
Fig. 3. Rare outlier DMR analysis identifies tandem repeat expansions.
A DMR plot depicting outlier hypermethylation of the CSNK1E 5’UTR and intron 1 in two probands with uDEEs (three additional replicate samples across both for a total of five samples), one mother, and two unaffected controls (total n = 8 red lines) detected through epivariation analysis. B The upper panel shows expression values from RNA-seq of human-derived fibroblasts for individuals with CSNK1E hypermethylation (n = 3 biological replicates) compared to individuals with control methylation levels (n = 3 biological replicates). Significance between groups was determined by a two-tailed paired t-test (p = 0.029 for gene counts and p = 0.0169 for transcripts per million or TPM). *P < 0.05. A representative predicted expression plot from drop-out analysis using the OUTRIDER algorithm is shown at the lower portion of the panel. See Supplementary Fig. 9 for the individual OUTRIDER plots for each family and significance information. C Unphased IGV view of LRS data showing CpG sites that are methylated (red) and unmethylated (blue). The CGG repeat expansion seen in the proband was inherited from the mother (Family 1) and is shown as purple squares denoting insertions in the reads (black arrows); not all reads that are methylated show the insertion as they terminated within the inserted sequence and are clipped by the alignment process.

