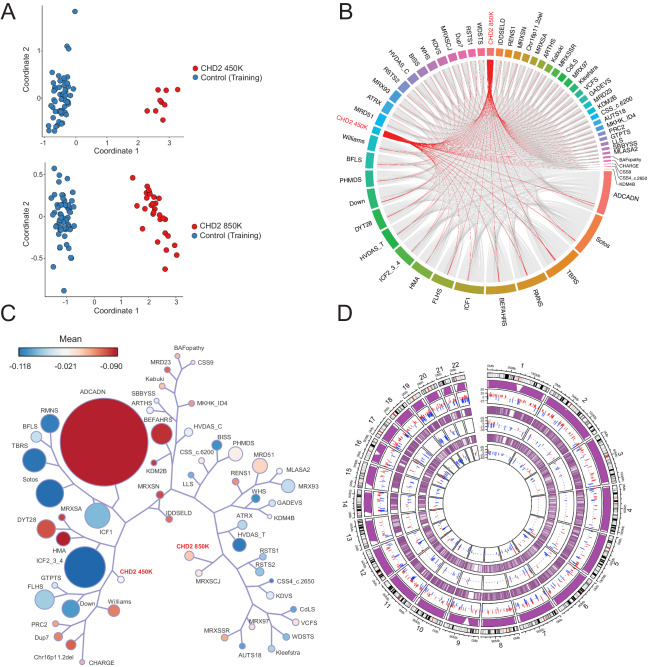
Fig. 6. Insights from the CHD2 episignature.
A Multidimensional scaling (MDS) plot showing clustering of individuals with pathogenic CHD2 variants (red, upper) for the previously described CHD2 450 K (n = 9) episignature with shared 450 K and 850 K array probes clusters away from the controls (n = 54, blue). The refined CHD2 850 K (n = 29) episignature (red, lower) clusters away from unaffected controls (n = 58, blue). B Circos plot representing shared probes between episignatures. Differentially methylated probes (DMPs) shared between the CHD2 850 K cohort (bold red), CHD2 450 K cohort (red), and 55 other episignatures on EpiSign with functional correlation analysis previously published31. The thickness of the connecting lines corresponds to the number of probes shared between the cohorts. C Tree and leaf visualization of Euclidean clustering of episignatures. Tree and leaf visualization for all 57 cohorts using the top 500 DMPs for each group (for cohorts with less than 500 DMPs, all DMPS were used). Cohort samples were aggregated using the median value of each probe within a group. A leaf node represents a cohort, with node sizes illustrating relative scales of the number of selected DMPs for the respective cohort, and node colors are indicative of the global mean methylation difference, a gradient of hypomethylation (blue) or hypermethylation (red). D Circular karyotype plot showing overlap of CHD2 450 K episignature probes (inner circle, n = 200), with CHD2 850 K episignature probes (middle circle, n = 200), and WGBS DMRs (n = 4 CHD2 vs. n = 6 unaffected controls) derived with at least a 15% methylation difference for the condensed visual representation (outer circle, n = 411). Each line depicts a probe or DMR where red denotes hypermethylation and blue denotes hypomethylation. The purple tracks depict coverage of the 450 K array probes (inner), 850 K EPIC array probes (middle), and WGBS reads (outer). Refer to Supplementary Fig. 33 for linear karyotype DMR plots for chr1-22.

