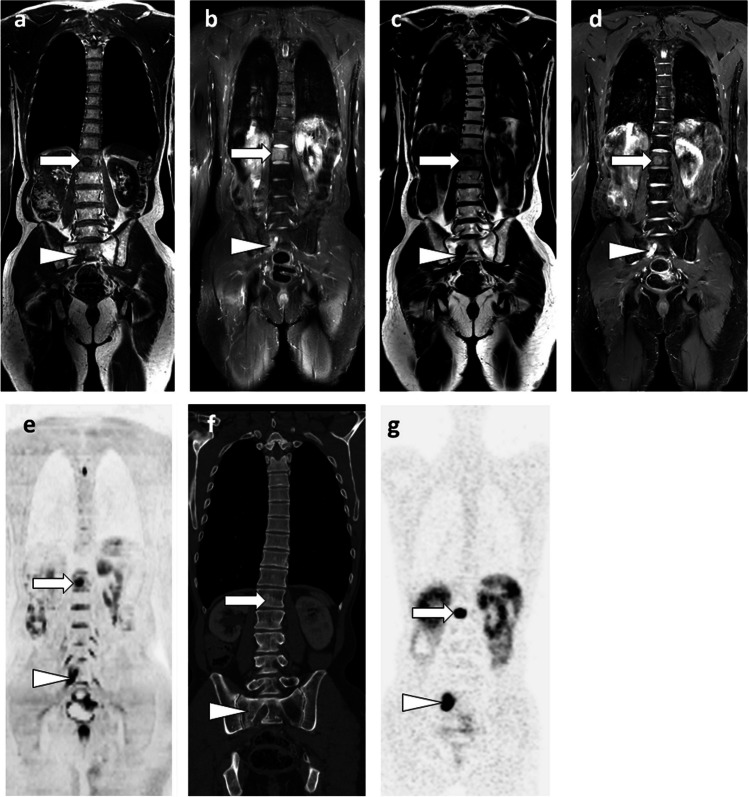
Fig. 2.
46-year-old man with newly diagnosed neuroendocrine cancer: comparison of T1 and STIR sequences with a single T2 Dixon sequence, DWI and PET/CT. a, b Coronal T1 and STIR WB-MRI sections show two metastases within the L1 vertebral body (arrow) and the right sacral wing (arrowhead). c, d Fat-only (FO) (c) and water-only (WO) (d) images of the corresponding FSE T2 Dixon sequence, show exactly the same lesions (in a single sequence). e Coronal high b-value (b = 1000 s/mm2, inverted grayscale) DWI sequence shows the same lesions. f, g Gallium-68 dotatate PET/CT (octreo-PET) show the same lesions, slightly sclerotic on CT (f) and showing intense tracer uptake (g)

