Fig. 3.
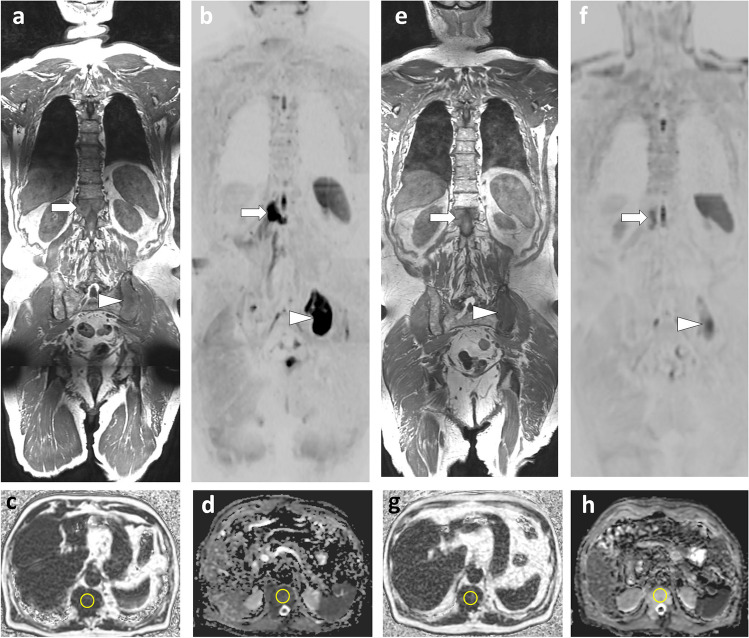
77-year-old man with multiple myeloma: WB-MRI studies at diagnosis and after treatment. a, b Coronal T1 (a) and high b-value (inverted grayscale window, b = 1000 s/mm2) DWI (b) sequences show a large lesion within the T12 vertebral body extending into the right paraspinal soft tissues (arrow). Another lesion is seen within the left posterior iliac crest (arrowhead). c Axial fat fraction (FF) map; measurement within the T12 body (circle) shows the absence of residual marrow fat (FF = 0%). d Axial ADC map; measurement within the T12 body (circle) shows increased ADC (750 mm2/s), indicating tumor infiltration. e–h Morphologic images and corresponding quantitative maps from the MRI follow-up examination performed two months later, after initiation of systemic treatment and irradiation of the lesions: regression in size and fading of the lesions on morphologic images (arrows and arrowheads in e, f). Measurements within the body of T12 show increased FF (16%) and ADC (1235 mm2/s) (circles), indicating lesion response to treatment

