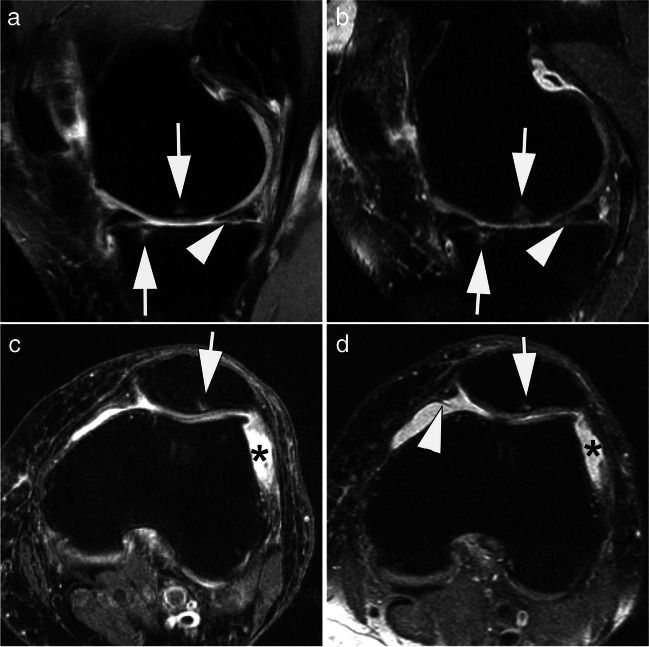
Fig. 5.
Comparison of a 1.0-T small-bore extremity system with a standard 1.5 T large-bore MRI for assessment of knee osteoarthritis. A Standard 1.5-T proton density-weighted fat-suppressed image shows small subchondral bone marrow lesions (BMLs) at the central medial femur and the anterior medial tibia (arrows). In addition, there is a horizontal oblique degenerative tear of the posterior horn of the medial meniscus (arrowhead). B At 1.0-T extremity MRI, BMLs (arrows) and tear (arrowhead) are visualized with similar image quality. C Axial 1.5-T proton density-weighted fat-suppressed image shows a small BML at the lateral patella (arrow) and joint effusion (asterisk). D Axial 1.0-T image shows BML (arrow) and effusion (asterisk) in similar fashion. In addition, there is a small medial patellar plica (arrowhead). TA: 3:53 min (A), 4:44 min (B), 2:45 min (C), 2:59 min (D)

