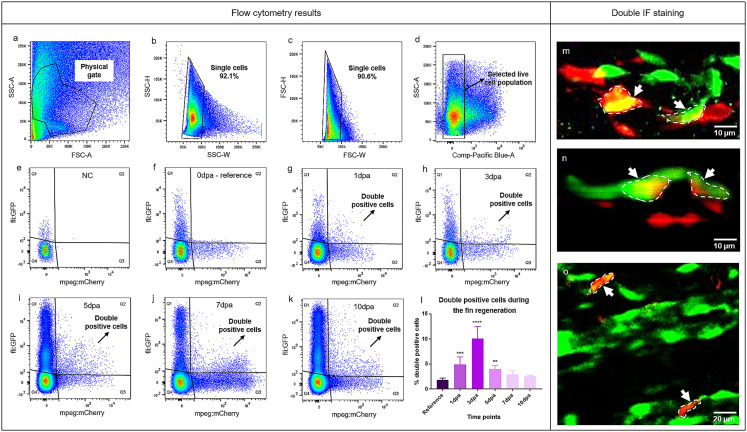
Fig. 4.
Co-localization of MΦ and EC markers at the regenerating vascular front. Plots (a-k) and quantification of double positive cells (l) from flow cytometry analysis are shown. Plots a, b, c and d represent gating parameters and selection of targeted cell population. Plot e shows the negative control (NC); f-k display representative plots during the early caudal fin regeneration (0dpa, 1dpa, 3dpa, 5dpa, 7dpa, 10dpa). Q1 represents green positive cells (ECs), Q2 represents double positive cells expressing MΦ and EC markers in a single cell, Q3 represents red positive cells (MΦ) and Q4 represents double negative cells. Graph l displays quantification of double positive cells over the course of 10 days (0dpa-10dpa, n = 7). Percentage of double positive cells significantly increased at 1dpa, 3dpa and 5dpa. Double whole-mount immunofluorescence staining is showing ECs in green and MΦ in red in the regenerating fin at 7dpa (m-o). m-o reveals the overlap of EC and MΦ markers within a single cell (white dash line, arrows). Images are acquired by confocal microscopy

