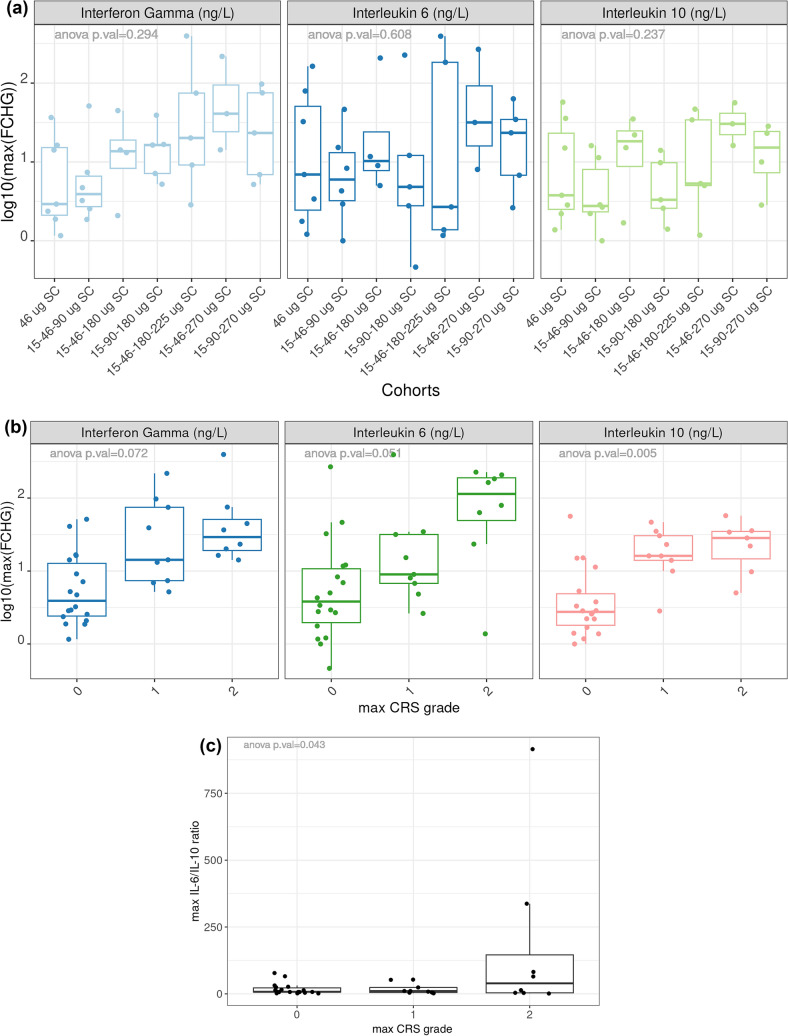
Fig. 4.
Cytokine induction following administration of JNJ-78306358: a Maximum fold change after treatment dose compared to baseline arranged by cohorts b Maximum fold change after treatment dose compared to baseline arranged by CRS grade c Comparison of IL-6 to IL-10 ratio arranged by CRS grade. a Box plot of maximum fold change (FCHG) of serum IFNγ, IL-6 and IL-10 across cohorts. Maximum fold change, shown in log10 scale, is defined as the highest fold change between post-treatment and baseline values across all sample collection timepoints. b Box plot of maximum fold change of serum IFNγ, IL-6 and IL-10 by CRS grade. No CRS is represented by grade 0. Maximum fold change, shown in log10 scale, is defined as the highest fold change between post-treatment and baseline values across all sample collection timepoints. c Box plot of maximum IL-6 to IL-10 ratio by CRS grade. Maximum ratio is defined as the highest ratio between IL-6 and IL-10 values across all sample collection timepoints. CRS cytokine release syndrome, FCHG fold change, IL interleukin

