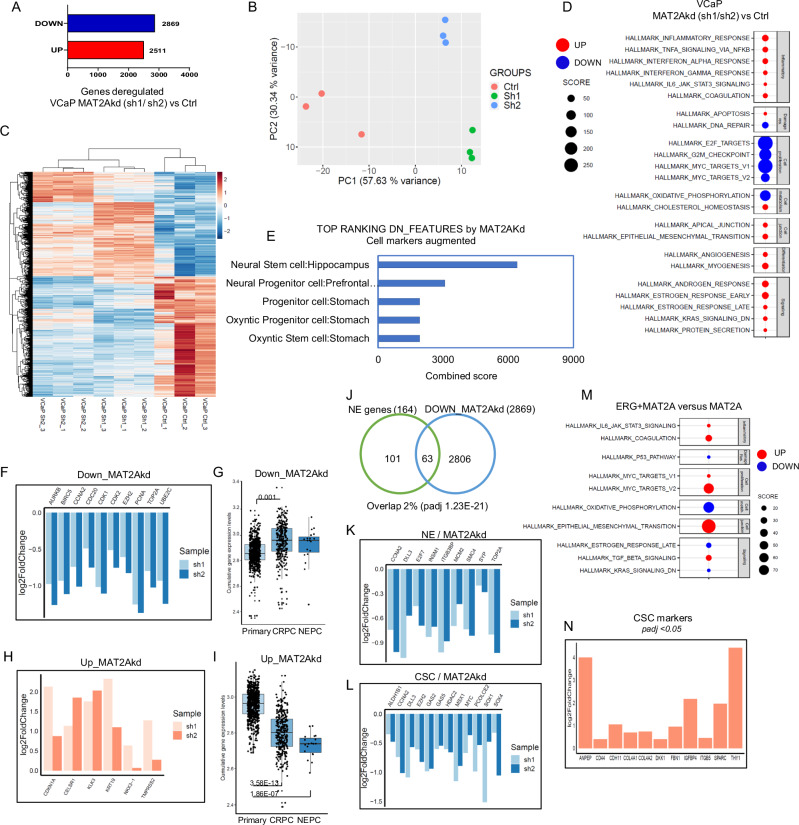
Fig. 2. MAT2A promotes cancer-associated transcriptional features in ERG fusion-positive cells.
A Number of genes affected by knockdown of MAT2A (Sh1 and Sh2) in VCaP cells (p-value ≤ 0.05). B Principal component analysis (PCA) plot of VCaP cell lines, colored according to the condition (Ctrl, Sh1, Sh2). C Heatmap of differentially expressed genes in MAT2Akd (VCaP Sh1 and VCaP Sh2) versus control VCaP cells (VCaP Ctrl). Replicates (n = 3 biological replicates) are indicated. D Hallmark enrichment analysis of MAT2Akd VCaP cells (Sh1 and Sh2) compared to control cells, performed with cameraPR function. Down-regulated pathways are colored in blue, up-regulated pathways are colored in red. E Functional annotation of top-ranking features of MAT2Akd VCaP cells (Sh1 and Sh2) performed with enrichR (cell markers augmented). F Fold changes of selected oncogenic drivers in MAT2Akd cells (Sh1 and Sh2) versus VCaP control, evaluated by RNA-seq. G Cumulative gene expression level of down-regulated genes in MAT2Akd VCaP cells (Sh1 and Sh2) in the cohort of primary (n = 714), CRPC (n = 316) and NEPC (n = 19) patients. H Fold changes of selected canonical androgen genes in MAT2Akd (Sh1 and Sh2) versus VCaP control cells evaluated by RNA-seq. I Cumulative gene expression level of up-regulated genes in MAT2Akd VCaP cells (Sh1 and Sh2) in the cohort of primary (n = 714), CRPC (n = 316) and NEPC (n = 19) patients. J Venn diagram showing the overlap between down-regulated genes in VCaP MAT2Akd cells (Sh1 and Sh2) and gene set associated with NEPC. Test: Fisher exact test. Fold changes of selected NEPC (K) and cancer stem cell genes (L), repressed by MAT2Akd in VCaP cells (Sh1 and Sh2). M Hallmark enrichment analysis of ERG + MAT2A RWPE-1 cells compared to RWPE-1 MAT2A performed with cameraPR function. Down-regulated pathways are colored in blue, up-regulated pathways are colored in red. N Fold change of selected CSC- and EMT-related genes up-regulated in RWPE-1 ERG + MAT2A versus RWPE-1 MAT2A. For box-and-whisker plots in G and I, the line inside the box shows the median value. The bounds of the box represent the 25th–75th percentiles, with whiskers at minimum and maximum values. One-way-ANOVA was used to test significant differences between groups.

