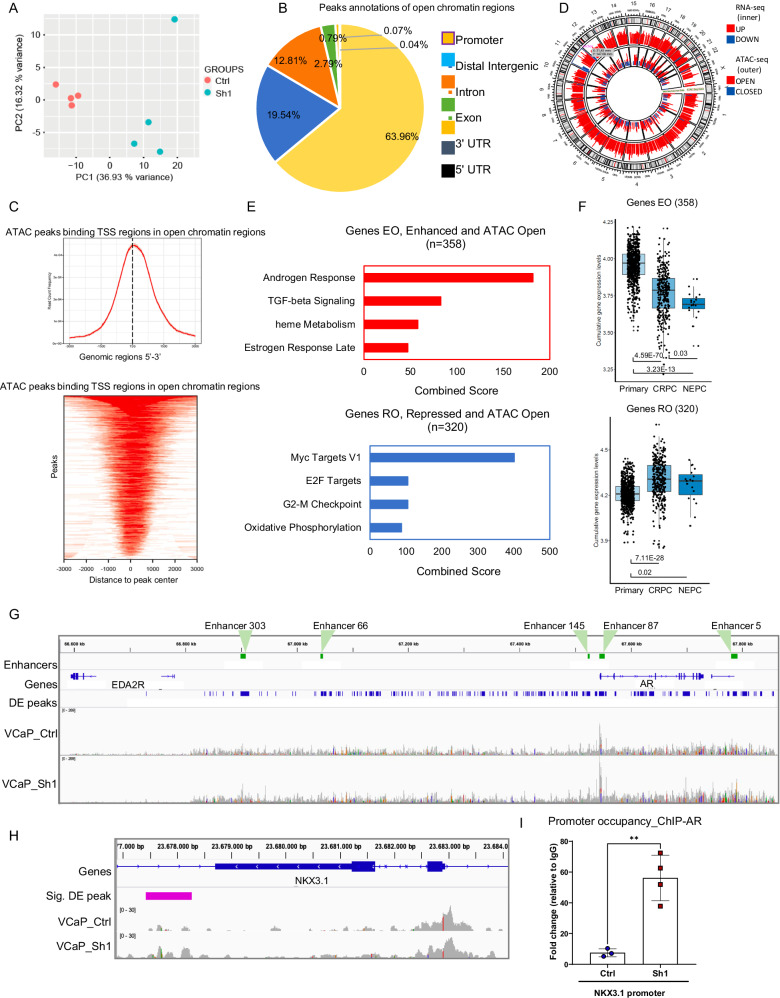
Fig. 3. MAT2A controls chromatin accessibility at the AR enhancer.
A PCA plot showing VCaP samples examined through ATAC-seq (VCaP Ctrl and MAT2Akd Sh1). B Diagram showing the distribution of the annotated peaks in the open regions. C Top, ATAC-seq peaks binding TSS regions in open chromatin regions. Bottom peak location in TSS regions. D Circular plot of the integrative analysis ATAC-seq/RNA-seq showing the distribution of the differentially expressed peaks (outer layer) and the significantly expressed genes (inner layer). E Functional annotation of the genes located in the regions affected by chromatin changes upon MAT2Akd. Top, pathways activated by MAT2Akd. Bottom, pathways repressed by MAT2Akd. F Box plots of cumulative gene expression of the genes emerged from the integrative RNA-seq/ATAC-seq analyses. Top, genes with enhanced expression after opening of the chromatin. Bottom, genes with reduced expression after chromatin opening. Primary, n = 714; CRPC, n = 316; NEPC, n = 19. For box-and-whisker plots, the line inside the box shows the median value. The bounds of the box represent the 25th–75th percentiles, with whiskers at minimum and maximum values. G ATAC-seq peaks at AR gene and enhancer. Peak profiles of VCaP MAT2Akd and VCaP control samples. Plot was generated through IGV software. Significantly differentially expressed peaks, with a Log2FC ≥ 1.5, between VCaP MAT2Akd and control are represented in blue. Enhancer regions of AR are highlighted in green. H ATAC-seq peaks at the NKX3.1 gene. Peak profiles from ATAC-seq of VCaP control (Ctrl) and VCaP MAT2Akd (Sh1) cells. Plot was generated as described above. I AR occupancy at the NKX3.1 promoter in VCaP control (n = 3 for Input and IgG and 4 for AR biological replicates) and MAT2Akd cells(Sh1) (n = 4 for Input and AR and n = 3 for IgG biological replicates) All error bars, mean ± s.d. **p < 0.01, two-sided t-test was used to test significant differences between groups.

