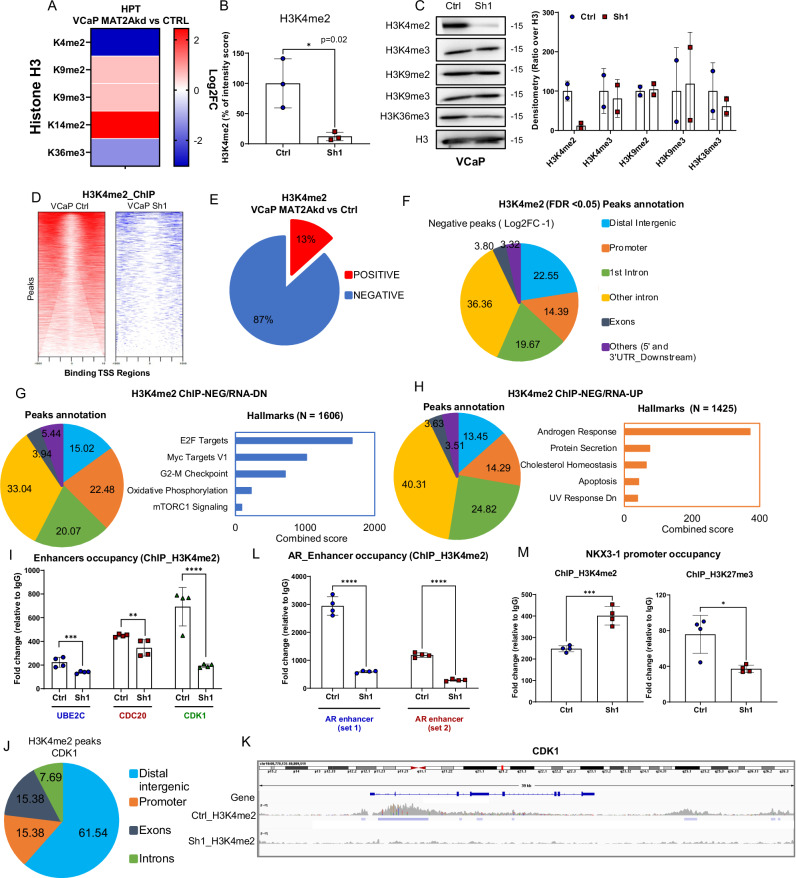
Fig. 4. MAT2A alters H3K4me2 distribution and activates an oncogenic transcriptional program.
A Heatmap generated by global profiling of histone H3 lysine methylation and including only the markers significantly changed in MAT2Akd (Sh1) versus VCaP control (Ctrl). Color coding in the heatmap represents the Log2FC of the intensity score for each modification in Sh1 versus Ctrl. P-values are also indicated. B Percentage of intensity score of H3K4me2 in indicated samples (n = 3 biological replicates); p-value = 0.02. C Representatives immunoblot of VCaP control (Ctrl) and MAT2Akd (Sh1) with indicated Ab. (n = 2 independent experiments). Right, densitometries of two independent experiments of indicated histone marks are shown. D Density plot of H3K4me2 peaks around the transcription start site of VCaP Ctrl (left) and VCaP Sh1 (right). The heatmaps represents all the peaks that were called for each condition. Only the peaks around the TSS (−1500, +1500) were considered. VCaP Ctrl samples (15018 peaks); VCaP Sh1(2203 peaks). E Percentage of peak changes in VCaP MAT2Akd cells compared to VCaP Ctrl. F Peak distribution of negative H3K4me2 peaks in VCaP MAT2Akd cells. G Right, peak annotation of the genes with negative ChIP-seq peak and enhanced expression in RNA-seq. Left, hallmarks of genes with negative ChIP-seq peak and enhanced expression in RNA-seq. H Right, peak annotation of the genes with negative ChIP-seq peak and reduced expression in RNA-seq. Left, hallmarks of genes with negative ChIP-seq peak and reduced expression in RNA-seq. I Occupancy of H3K4me2 on the enhancer of UBE2C, CDK1 and CDC20 in VCaP Ctrl and VCaP Sh1 (n = 4 biological replicates). J Peak distribution of H3K4me2 on CDK1 in VCaP Sh1 compared to VCaP Ctrl (FDR < 0.05; Log2FC ± 1). K ChIP-seq peaks profile at the CDK1 gene of VCaP Ctrl and VCaP Sh1 cells. Plot was generated as described in Fig. 3G. L Occupancy of H3K4me2 on two enhancer regions of AR in VCaP Ctrl and VCaP Sh1 cells (n = 4 biological replicates). M Occupancy of H3K4me2 (left) and of H3K27me3 (right) on the promoter of NKX3.1 in VCaP Ctrl and VCaP Sh1 cells (n = 4 biological replicates). Molecular weights are indicated in kilodaltons (kDa). All error bars, mean ± s.d. *p < 0.05, **p < 0.01, ***p < 0.001 ****p < 0.0001. two-sided t-test was used to test significant differences between the two groups.

