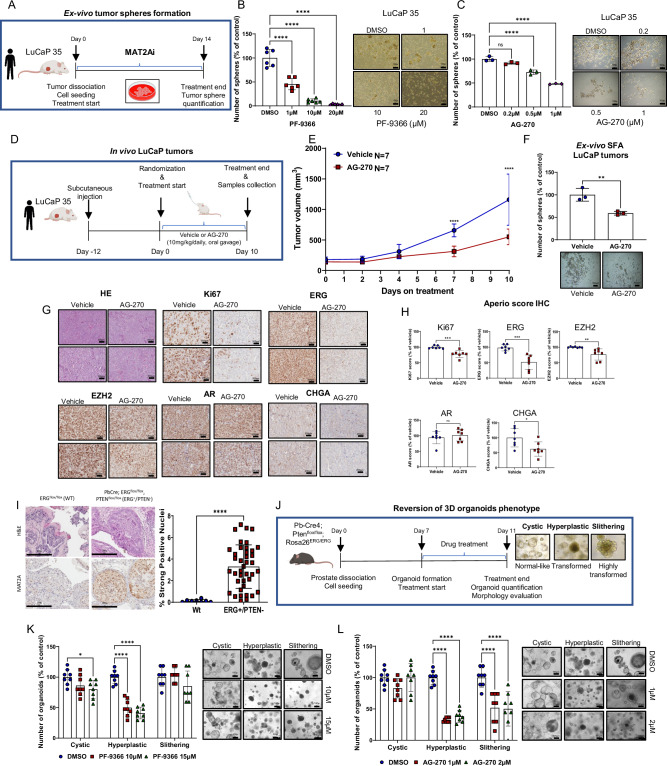
Fig. 5. Pharmacologic inhibition of MAT2A reverses stemness in vitro and ex-vivo and significantly reduces growth of human PDX in vivo.
A Schematic representation of ex-vivo SFA assay, starting from LuCaP 35. B Ex-vivo SFA from dissociated LuCaP 35 under treatment with the indicated concentration of PF-9366 Right, images of spheres at the indicated concentration (n = 6 biological replicates). Scale bars are 100 µm. C Ex-vivo SFA from dissociated LuCaP 35 under treatment with the indicated concentration of AG-270. Scale bars are 100 µm. Right, images of spheres at the indicated concentration (n = 3 biological replicates). D Schematic representation of systemic in vivo treatment of LuCaP 35 tumors with vehicle or AG-270. E Growth curve of LuCaP 35 xenografts. Mice (n = 7/group) were treated by oral gavage with either vehicle or AG-270. Tumor growth was monitored every 2 days with caliper. F Ex-vivo SFA assay from explanted LuCaP 35 tumors (n = 3 tumors/group) after treatment with either vehicle or AG-270. Right, images of spheres of indicated treatment groups. Scale bars are 100 µm. G Representative sections from the indicated LuCaP tumors. Scale bars are 200 µm. H Immunoscore of Ki67, ERG, EZH2, AR and CHGA of tumor xenografts shown in (E) (n = 7 mice/group/;n = 7 biological replicates) using the Aperio tool. I Representative immunohistochemical evaluation of MAT2A (left) and quantification (right) in prostate tissue from WT (Pb-Cre;ERGflox/flox; n = 4 mice, n = 8 technical replicates) and ERG + /PTEN-(Pb-Cre4;Ptenflox/flox;Rosa26ERG/ERG; n = 6 mice, n = 40 technical replicates). Scale bars, 200 µm. J Schematic representation of 3D organoids assay derived from ERG/PTEN prostates to evaluate the reversion of the organoid phenotype. K Organoids treated with the indicated doses of PF-9366 (n = 8 biological replicates). Right, representative images are shown. Scale bars, 100 µm. L Organoids treated with the indicated doses of AG-270 (n = 8 biological replicates). Right, representative images are shown. Scale bars are 100 µm. All error bars, mean ± s.d. Ordinary one-way-ANOVA was used to test significant differences between groups in all panels, except for (K, L) where was used two-way-ANOVA. P-value was determined using unpaired t-test in F–H and I. *p < 0.05, **p < 0.01, ***p < 0.001 ****p < 0.0001. Panels A, B and J Created with BioRender.com released under a Creative Commons Attribution-NonCommercial-NoDerivs 4.0 International license.

