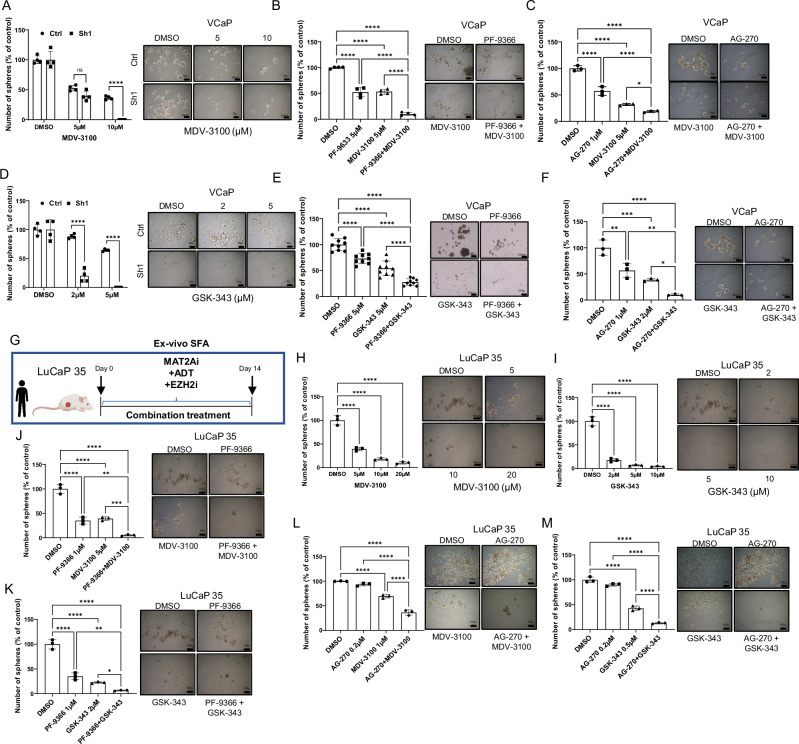
Fig. 7. Pharmacologic inhibition of MAT2A in ERG positive models reverses stemness and restores the sensitivity to enzalutamide and EZH2 inhibition.
A SFA in VCaP MAT2Akd cells with the indicated concentration of enzalutamide (MDV-3100) (n = 4 biological replicates for each drug concentration). Right, representative images of spheres. Scale bars are 50 µm. B SFA in VCaP cells under treatment with the indicated concentration of PF-9366 and MDV-3100, alone or in combination (n = 4 biological replicates for each drug concentration). Right, representative images of spheres. Scale bars are 50 µm. C SFA in VCaP cells under treatment with the indicated concentration of AG-270 and MDV-3100, alone or in combination (n = 3 biological replicates for each drug concentration). Right, representative images of spheres. Scale bars are 50 µm. D SFA in VCaP MAT2Akd cells with indicated concentration of GSK-343 (n = 4 biological replicates for each drug concentration). Right, representative images of spheres. Scale bars are 50 µm. E SFA in VCaP cells under treatment with the indicated concentration of PF-9366 and GSK-343, alone or in combination (n = 3 independent experiments, with 3 biological replicates for each drug concentration). Right, representative images of spheres. Scale bars are 200 µm. F SFA in VCaP cells under treatment with the indicated concentration of AG-270 and GSK-343, alone or in combination (n = 3 biological replicates for each drug concentration). Right, representative images of spheres. Scale bars are 50 µm. G Schematic representation of ex-vivo SFA assay, starting from LuCaP 35. H Ex-vivo SFA from dissociated LuCaP 35 under treatment with the indicated concentration of MDV-3100 (n = 3 biological replicates). Right, images of spheres at the indicated concentration. Scale bars are 100 µm. I Ex-vivo SFA from dissociated LuCaP 35 under treatment with the indicated concentration of GSK-343 (n = 3 biological replicates). Right, images of spheres at the indicated concentration. Scale bars, 100 µm. J Ex-vivo SFA from dissociated LuCaP 35 under treatment with the indicated concentration of PF-9366 and MDV-3100, alone and in combination (n = 3 biological replicates). Right, images of spheres at the indicated concentration. Scale bars, 100 µm. K Ex-vivo SFA from dissociated LuCaP 35 under treatment with the indicated concentration of PF-9366 and GSK-343, alone and in combination (n = 3 biological replicates). Right, images of spheres at the indicated concentration. Scale bars are 100 µm. L Ex-vivo SFA from dissociated LuCaP 35 under treatment with the indicated concentration of AG-270 and MDV-3100, alone and in combination (n = 3 biological replicates). Right, images of spheres at the indicated concentration. Scale bars, 100 µm. M Ex-vivo SFA from dissociated LuCaP 35 under treatment with the indicated concentration of AG-270 and GSK-343, alone and in combination (n = 3 biological replicates). Right, images of spheres at the indicated concentration. Scale bars are 100 µm. All error bars, mean ± s.d. *p < 0.05, **p < 0.01, ***p < 0.001 ****p < 0.0001. ns = no significant. One-way-ANOVA was used to test significant differences between groups in all panels, except for A and D where two-sided t-test was used. Panel G Created with BioRender.com released under a Creative Commons Attribution-NonCommercial-NoDerivs 4.0 International license.

