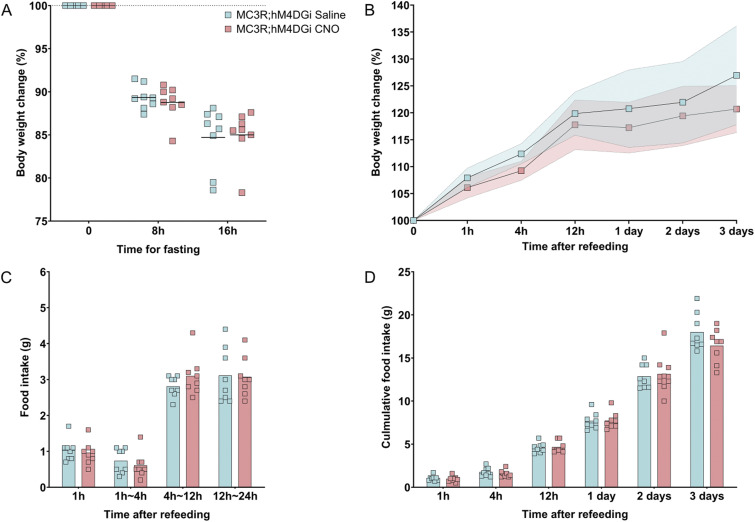
Figure 6. Inhibition of melanocortin 3 receptor (MC3R) neurons during overnight fasting in females.
(A) Body weight change during fasting (in percentage) was plotted in comparison to the body weight at fasting, before the first injection. Body weight was measured at 8 h fasting before the second injection, and 16 h before refeeding. (B) Body weight change after refeeding at different time points, data points indicate mean, colored area indicates SD. (C) Food intake (in grams) was measured during refeeding at different time intervals. (D) Cumulative food intake (in grams) was measured during refeeding at different time points. (A, B, C, D) Blue indicates MC3R; hM4DGi saline-treated control group and pink indicates MC3R; hM4DGi clozapine-n-oxide–treated group. N = 8 for both groups in all the graphs. Two-way ANOVA. No significance was detected.
Source data are available for this figure.

