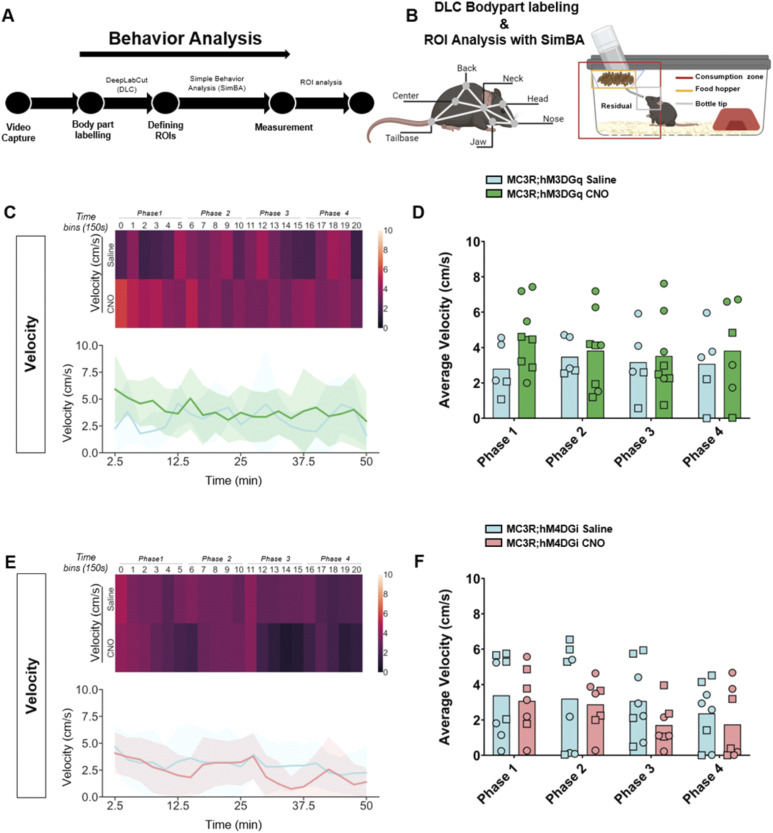
Figure S14. Behavior tracking of animal velocity during refeeding after melanocortin 3 receptor (MC3R) activation or inhibition.
(A) Analysis pipeline after video capture of animal behavior with refeeding. (B) Indications of body part labeling with DeepLabCut and analysis of regions of interest with SimBA. Selection of regions of interests within the home cage is indicated in the graphic. (C) Velocity (cm/second) in saline and clozapine-n-oxide (CNO)–treated MC3R; hM3DGq mice visualized with a heat map ((C) top) or line graphs ((C) bottom). (D) Average velocity in time bins 0–5 (Phase 1), 6–10 ((Phase 2), 11–15 (Phase 3), and 16–20 (Phase 4). Blue indicates the MC3R; hM3DGq saline-treated control group and green indicates the MC3R; hM3DGq CNO-treated group. Male data points are represented as circles and female data points as squares. (E) Velocity (cm/second) in saline- and CNO-treated MC3R; hM4DGi mice visualized with a heat map ((E) top) or line graphs ((E) bottom). (F) Average velocity in time bins 0–5 (Phase 1), 6–10 ((Phase 2), 11–15 (Phase 3), and 16–20 (Phase 4). Blue indicates the MC3R; hM4DGi saline-treated control group and pink indicates the MC3R; hM4DGi CNO-treated group. Male data points are represented as circles and female data points as squares.
Source data are available for this figure.

