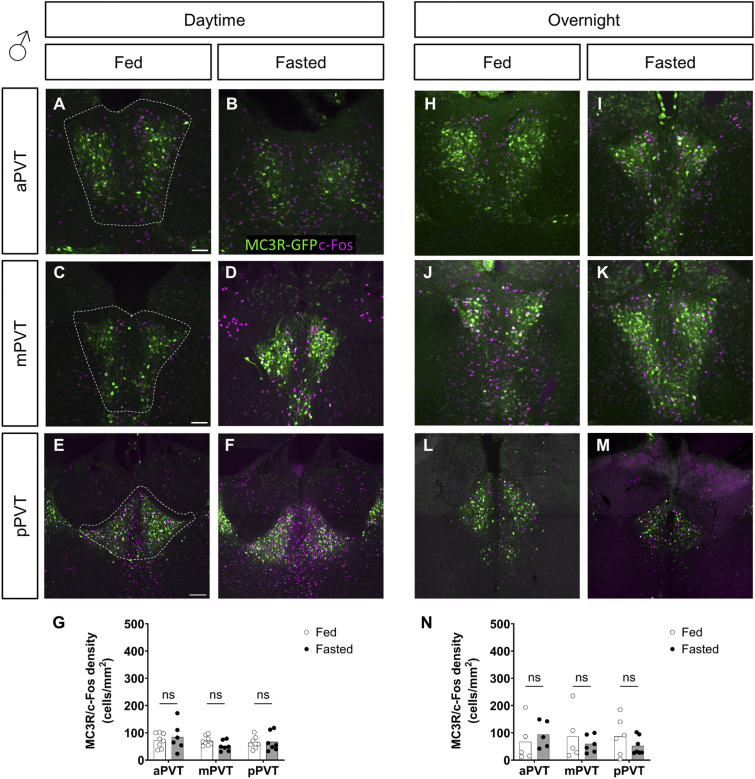
Figure S4. Comparison of MC3R-GFP/c-Fos colocalized cell density, in the paraventricular nucleus of the thalamus (PVT), of fed versus fasted male mice.
(A, B, C, D, E, F, G, H, I, J, K, L, M) Representative images of MC3R-GFP and c-Fos–positive cells the anterior PVT (aPVT), mid PVT (mPVT), and posterior PVT (pPVT). (A, C, E) The white dashed outline in (A, C, E) represent regions of interest drawn around the PVT for analysis. (G, N) Quantification of colocalized cell density in daytime (G) and overnight (N) fasting experiments. (E) Scale bars in (A, C) are 100 and 200 μm in (E). Unpaired Welch t tests: ns, non-significant.
Source data are available for this figure.

