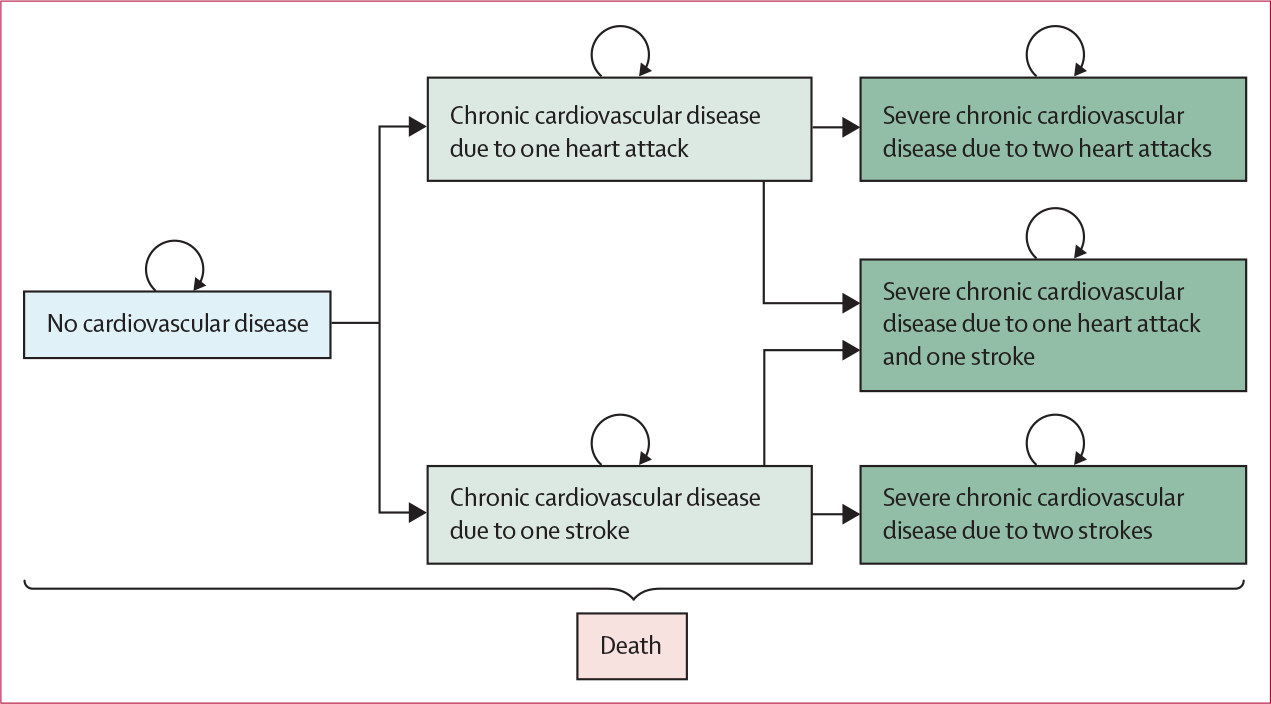
Figure 1: Markov diagram.

Rectangles show exclusive health states. Curved arrows indicate transitions to the same health state. Straight arrows indicate transitions to other health states. Transitions to the death state could occur from any state.

Rectangles show exclusive health states. Curved arrows indicate transitions to the same health state. Straight arrows indicate transitions to other health states. Transitions to the death state could occur from any state.