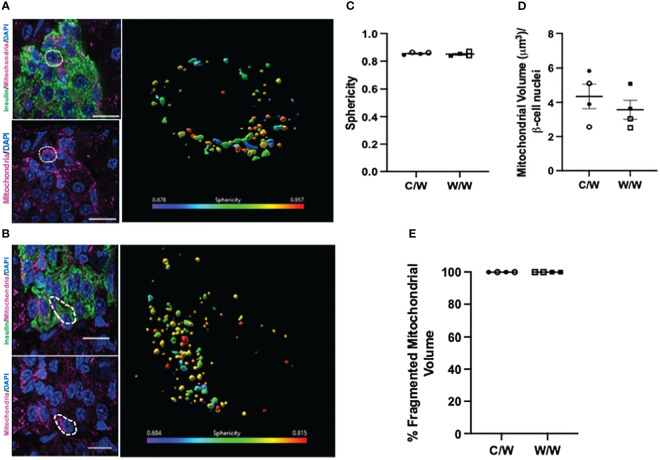
Figure 6.
3-dimensional deconvolution of the mitochondrial network in 1-year-old NHP beta cells. (A) Representative image depicting beta cells from a 1-year-old offspring of a control diet-fed dam. Right inset depicts a volume rendering from a representative beta cell (white dashed circle). Mitochondria are color coded based on sphericity. (B) Representative image depicting beta cell from a 1-year-old offspring of a Western-style diet-fed dam. Right inset depicts a volume rendering from a representative beta cell (white dashed circle). Mitochondria are color coded based on sphericity. (C) Average sphericity of mitochondria in non-human primate beta cells. (D) Mitochondrial volume in beta cells of 1-year-old NHP offspring. (E) Volume of mitochondria in offspring beta cells characterized as fragmented (sphericity >0.45). C/W: dam control diet/offspring Western-style diet; W/W: dam Western-style diet/offspring Western-style diet. C/W: n=4 (2M, 2F); W/W: n=4(2M, 2F). Scale bars = 4 μm.

