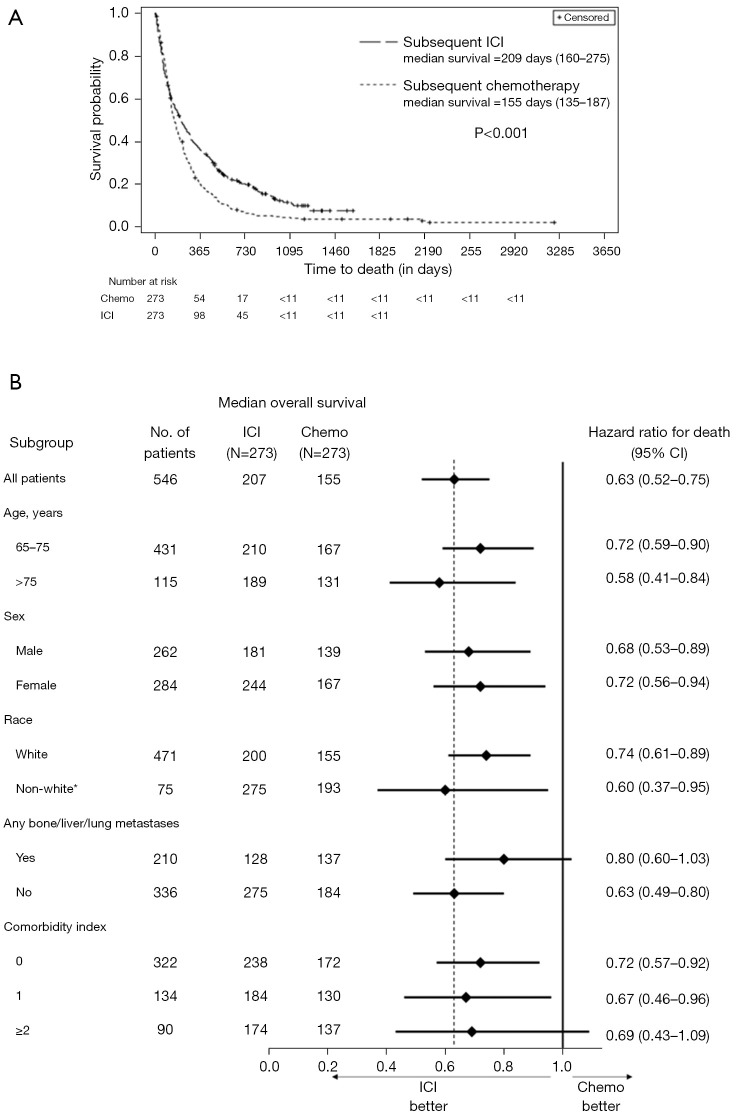
Figure 2.
Overall survival. (A) Kaplan-Meier survival curves of subsequent ICI vs. chemotherapy only; (B) hazard ratio (95% CI) for subsequent ICI vs. chemotherapy only in selected subgroups from unadjusted CPH model. Vertical dotted line in (B) denotes the hazard ratio in the overall population. *, non-White group has <30 patients with subsequent ICI treatment; thus, the estimate may not be reliable. All P values are significant at α <0.05 except non-White. According to the SEER-Medicare data use agreement, counts <11 are masked. Chemo, chemotherapy; ICI, immune checkpoint inhibitor; CI, confidence interval; CPH, Cox’s proportional hazards; SEER, Surveillance, Epidemiology, and End Results.

