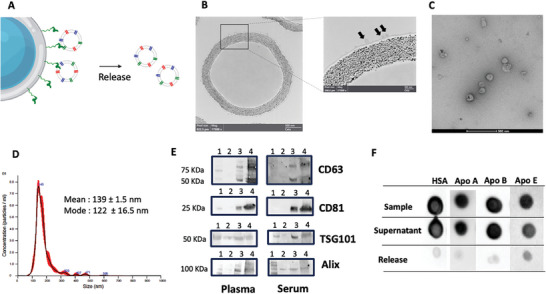
Figure 2.

A) scheme of the catch and release strategy here applied to demonstrate efficient isolation of small EVs, their release in intact conditions and negligible presence of contaminants after separation. B) TEM image of agarose beads and surface captured EVs (Black arrows). C) TEM image of EVs captured from serum after release with 0.5 m imidazole, showing intact, membrane‐enclosed vesicles. D) Representative NTA analysis (three technical replicates) of EVs captured from serum and released after imidazole treatment. The red line represents the standard deviation of the medium from three analysis. Overestimation of EV diameter by NTA could be ascribed to instrument inability to detect EVs <70 nm. E) Western Blot detecting typical EV‐associated surface (CD63 and CD81) and luminal (TSG101 and Alix) markers in the released particles (Lane 3) after capturing from Plasma (left panels) and Serum (right panels). Lane 1: Molecular Marker. Lane 2: Red Blood Cell EVs (negative control for tetraspanin) Lane 4: Commercial standard of HEK cells derived EVs (positive control). Thirty‐two microliters of sample were loaded in each well. F) Immune dot‐blot analysis to check presence of common contaminants: Human Serum Albumin (HSA) Apolipoproteins A, B, and E (Apo A, Apo B, Apo E respectively) in the starting Sample (Serum), in the Supernatant after capturing and in the Released EV fraction. Negligible contaminant signals are detectable after EV isolation. Results from other pre‐analytical conditions tested, plasma‐EDTA, plasma‐heparin and plasma‐citrate are shown in Figure S1 (Supporting Information).
