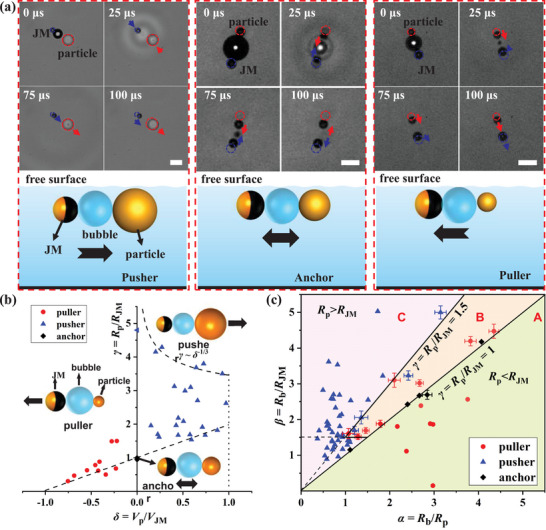
Figure 3.

a) Representative snapshots and schematic diagram illustrating the three modes: pusher, anchor, and puller. The blue and red dotted circles indicate the initial positions of the JM and particle, respectively. Scale bar: 20 µm. Differentiating between the two fundamental working modes of the BMT: pusher versus puller. b) Phase diagram depicting the particle–JM size ratio γ versus the velocity ratio δ. c) Phase diagram showing the bubble–JM size ratio β versus the bubble–particle size ratio α. The experimental sample size n shown in (b) and (c) is up to n = 55.
