
Figure 4.
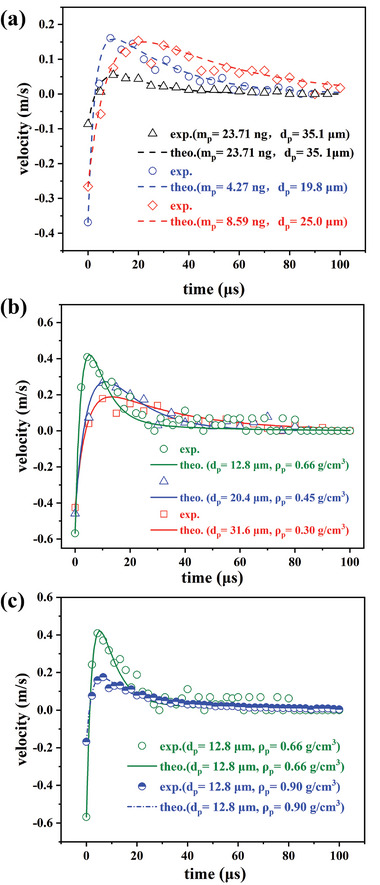
Comparison between the measured transient velocity variations and their fitted curves based on Equation (3). a) Results obtained using PS microspheres with fixed densities and different diameters dp . b) Results obtained using HGMs with varying diameters dp and effective densities ρp . The inset displays the measured effective densities ρp in relation to their diameters dp , consistent with the theoretical prediction of Equation (6) represented by the solid curve. c) The increase in effective density ρp (blue dashed curve with half solid circles) of an HGM by coating a 40 nm platinum layer is accurately detected by BMT.