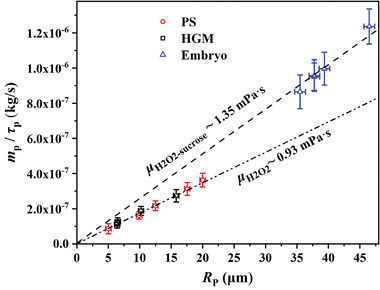
Figure 5.

A comparison of all experimental data with the theoretical master curve mp /τp versus Rp based on Equation (5). The red circles are the results using PS microparticles discussed in Section 3.1, the black squares are the results of HGMs discussed in Section 3.2, and the blue triangles are the results of mice embryos discussed in Section 3.3. The measurement in the same solution follows the same master curve mp /τp versus Rp with the slope determined by the solution viscosity μ. PS microparticles and HGMs were measured in H2O2 solutions at ≈22 – 23 °C, manifesting a slope of μ = 0.93 mPa.s. The mice embryos were measured in 10% sucrose solutions whose viscosity is shown to be μ = 1.35 mPa.s. The error bars are evaluated based on 90% confidence interval of fitting.
