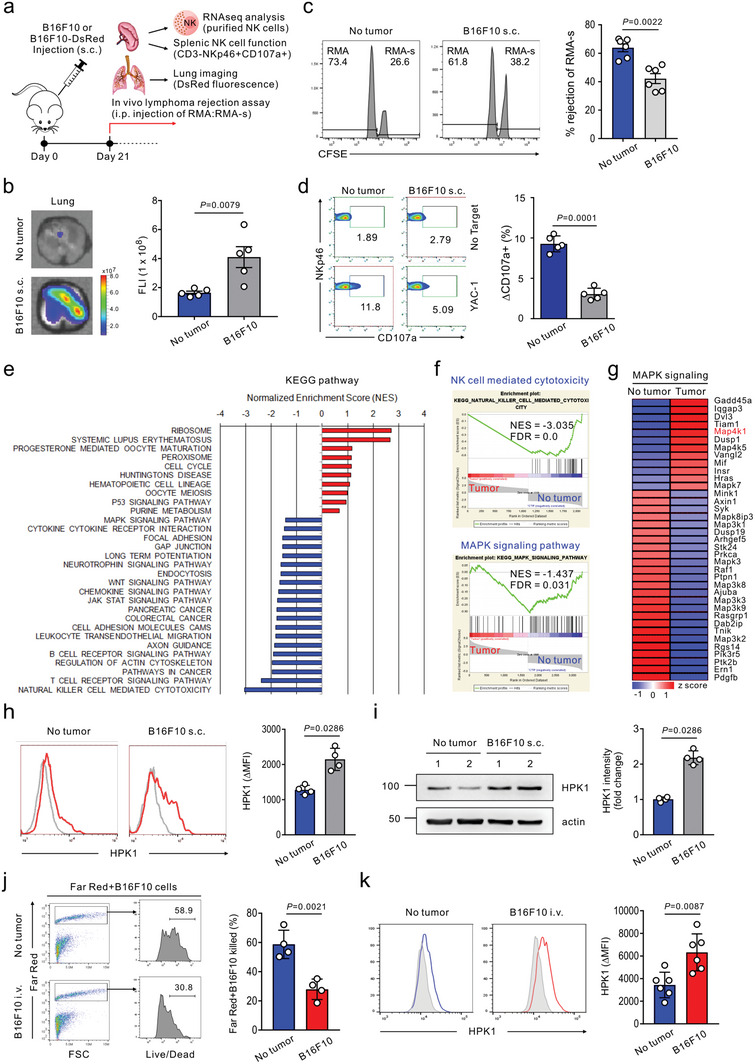
Figure 1.

Dysregulated HPK1 expression correlates with peripheral NK cell dysfunction and spontaneous melanoma metastasis. a) Schematic diagram of the experimental design and steps for the in vivo and ex vivo studies 21 days after DsRed‐B16F10 or B16F10 melanoma inoculation. These studies include the imaging of spontaneous lung metastasis, in vivo lymphoma rejection assay, assessment of cytolytic activity of splenic NK cells, and RNA‐seq analysis of purified splenic NK cells. b) Representative lung fluorescence images showing spontaneous lung metastasis (left) and graph of its quantification by fluorescence intensity (FLI) (right) following subcutaneous (s.c.) injection of DsRed‐B16F10 cells (n = 5 mice per group). Tumor‐free mice were used as controls. c) NK cell‐mediated lymphoma clearance assay in control tumor‐free or B16F10‐s.c. inoculated mice (n = 6 mice per group) showing the representative result (left) and graph (right) of the percent cleared NK‐sensitive RMA‐s cells relative to NK‐resistant RMA cells. d) Degranulation assay of splenic NK cells from control tumor‐free or B16F10‐s.c. inoculated mice (n = 5 mice per group) against YAC‐1 cells. Representative result (left) and graph (right) showing the percent increase of CD107a+ NK cells after stimulation with YAC‐1 cells relative to CD107a+ NK cells without stimulation (ΔCD107a+ cells). e) KEGG analysis of genes that are enriched in splenic NK cells from control tumor‐free mice versus B16F10‐s.c. inoculated mice (day 21). Analysis was performed on RNA pooled from 3 individual mice per group. f) GSEA of genes that are upregulated in comparison of NK cell‐mediated cytotoxicity or MAPK signaling pathway between splenic NK cells from control tumor‐free and B16F10‐s.c. inoculated mice (day 21). g) Heatmap of DEGs in comparison of MAPK signaling between splenic NK cells from control tumor‐free and B16F10‐s.c. inoculated mice (day 21). h,i) Flow cytometry (h) and Western blot (i) analysis of HPK1 expression in splenic NK cells from control tumor‐free or B16F10‐s.c. inoculated mice (day 21) (n = 4 mice per group). Representative result (left) and graph (right) showing the MFI (h) of HPK1 expression relative to isotype control (ΔMFI) and the intensity (i) of HPK1 expression in NK cells from tumor‐burdened mice relative to NK cells from control tumor‐free mice (fold change). j) Representative flow cytometric analysis of NK cell cytotoxicity against B16F10 cells in the control tumor‐free or metastasis‐bearing lungs of mice (day 21) (n = 4 mice per group) (left) and graph showing Live/Dead stain‐positive dead cells (right). Cytotoxicity was measured after in vitro coculture with Far Red‐labeled B16F10 cells for 6 h, followed by staining with Live/Dead Green cell dye. k) Flow cytometric analysis of HPK1 expression in NK cells from control tumor‐free or metastasis‐bearing lungs of mice (day 21) relative to isotype control (ΔMFI) showing the representative result (left) and graph (right) (n = 6 mice per group). Data were pooled from 2 independent experiments (b–d and h–k) and are expressed as mean ± SEM (b and c) or mean ± SD (d, h, i, j, and k); each dot represents an individual mouse. Data were analyzed using the Mann‐Whitney U‐test (b, c, h, i, and k) and two‐tailed unpaired t‐test (d and j); actual P‐values are indicated.
