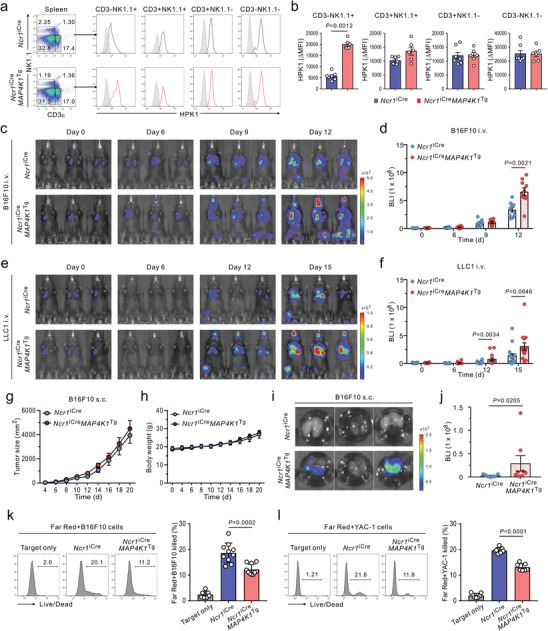
Figure 2.

Conditional HPK1 overexpression in NK cells exacerbates spontaneous and experimental melanoma metastasis by driving NK cell dysfunction. a,b) Representative (a) and quantitative (b) flow cytometric analysis of HPK1 expression in lymphocytes, graphed on CD3ε by NK1.1 dot plots, among CD45+ cell populations in the spleen of Ncr1 iCre (n = 7 mice) versus Ncr1 iCre MAP4K1 Tg (n = 6 mice) mice. Selective overexpression of HPK1 in CD3−NK1.1+ NK cells is shown in Ncr1 iCre MAP4K1 Tg mice compared with Ncr1 iCre mice. c,d) Representative images (c) and quantification (d) of metastasis to multiple organs including the lung in Ncr1 iCre or Ncr1 iCre MAP4K1 Tg mice (n = 10 mice per group) after administration of B16F10‐Luc2 cells by luciferase‐based bioluminescence imaging (BLI). (e,f) Representative images e) and quantification f) of metastasis in Ncr1 iCre (n = 16 mice) or Ncr1 iCre MAP4K1 Tg (n = 14 mice) mice following administration of LLC1‐Luc2 cells by BLI. g–j) B16F10‐Luc2 cells were injected subcutaneously into Ncr1 iCre (n = 7 mice) or Ncr1 iCre MAP4K1 Tg mice (n = 8 mice). Shown are the tumor sizes g), body weights (h), representative lung bioluminescence images showing spontaneous lung metastases (i), and quantification of lung metastases by BLI (j) on day 20. k,l) Flow cytometric analysis of NK cell cytotoxicity against B16F10 cells (k; n = 10 mice per group) and YAC‐1 cells (l; n = 7 mice per group) in the spleen of Ncr1 iCre or Ncr1 iCre MAP4K1 Tg mice showing the representative result (left) and graph (right) of Live/Dead stain‐positive dead cells. Data were pooled from 2 or 3 independent experiments and are expressed as mean ± SEM (b, d, f, g, h, and j) or mean ± SD (k and l); each dot represents an individual mouse. Data were analyzed using the Mann‐Whitney U‐test (b, d, f, j) and 2‐tailed unpaired t‐test (k, l); actual p‐values are indicated.
