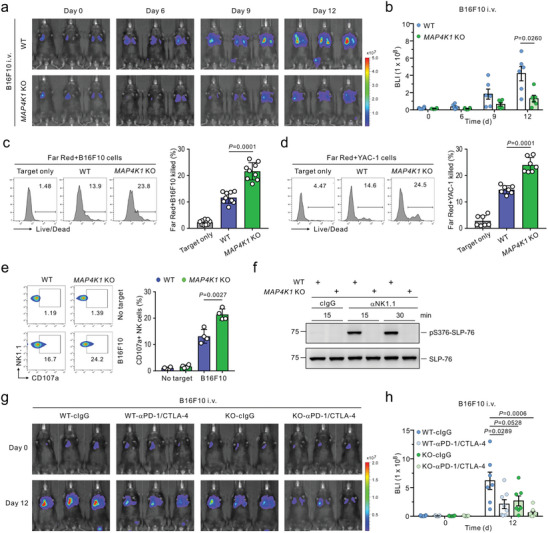
Figure 5.

HPK1 deficiency enhances the anti‐metastatic effect of NK cells and the efficacy of checkpoint immunotherapy. a,b) Representative images (a) and quantification (b) of pulmonary metastasis in WT or MAP4K1 KO mice (n = 6 mice per group) following intravenous (i.v.) administration of B16F10‐Luc2 cells by BLI. c,d) Flow cytometric analysis of NK cell cytotoxicity against B16F10 cells (c; n = 9 mice per group) and YAC‐1 cells (d; n = 7 mice per group) in the spleen of WT or MAP4K1 KO mice showing the representative result (left) and graph (right) of Live/Dead stain‐positive dead cells. e) Degranulation assay of splenic NK cells against B16F10 cells (n = 4 mice per group). Representative result (left) and graph (right) showing percent increase of CD107a+ NK cells. (f) Purified splenic NK cells from WT or MAP4K1 KO mice were stimulated with control IgG or anti‐NK1.1 Ab for the indicated times. Cell lysates were immunoblotted for phospho‐SLP‐76 at serine 376 (pS376) or total SLP‐76. Data are representative of 3 independent experiments. g,h) WT or MAP4K1 KO mice were i.v. injected with B16F10‐Luc2 cells and treated with either control IgG (500 µg) or anti‐PD‐1 and CTLA‐4 (250 µg each) on days 0 and 3 postinjection, respectively (n = 7,8 mice per group). Shown are the representative images (g) and quantification (h) of lung metastasis by BLI (day 12). Data were pooled from 2 or 3 independent experiments (a‐e, g, and h) and are expressed as mean ± SEM (b and h) or mean ± SD (c, d, and e); each dot represents an individual mouse. Data were analyzed using the Mann‐Whitney U‐test (b, h) and two‐tailed unpaired t‐test (c‐e); actual p‐values are indicated.
