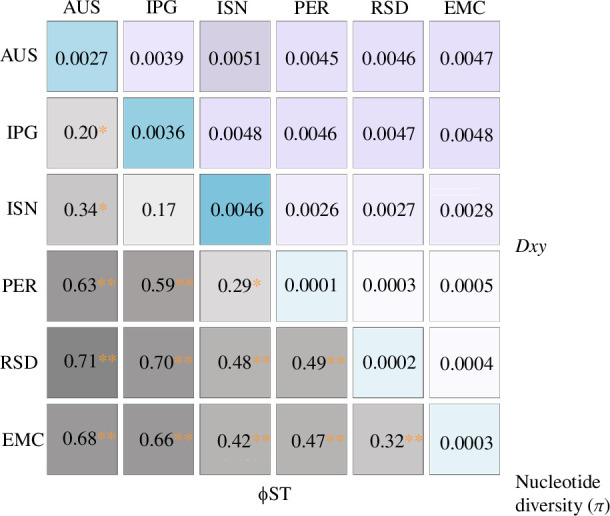
Figure 4.

Significant population structure between regionally defined dugong populations in the Indo-Pacific based on MT genome data. A heatmap depicts pairwise measures of absolute (Dxy: pink) and relative (ΦST: grey) divergence between populations. Nucleotide diversity (π: blue) within populations is given on the diagonal. Populations are coded as shown in table 1. Darker colours denote higher divergence or greater diversity. Significant p-values are indicated with a red asterisk (*≤0.05; **≤0.01).
