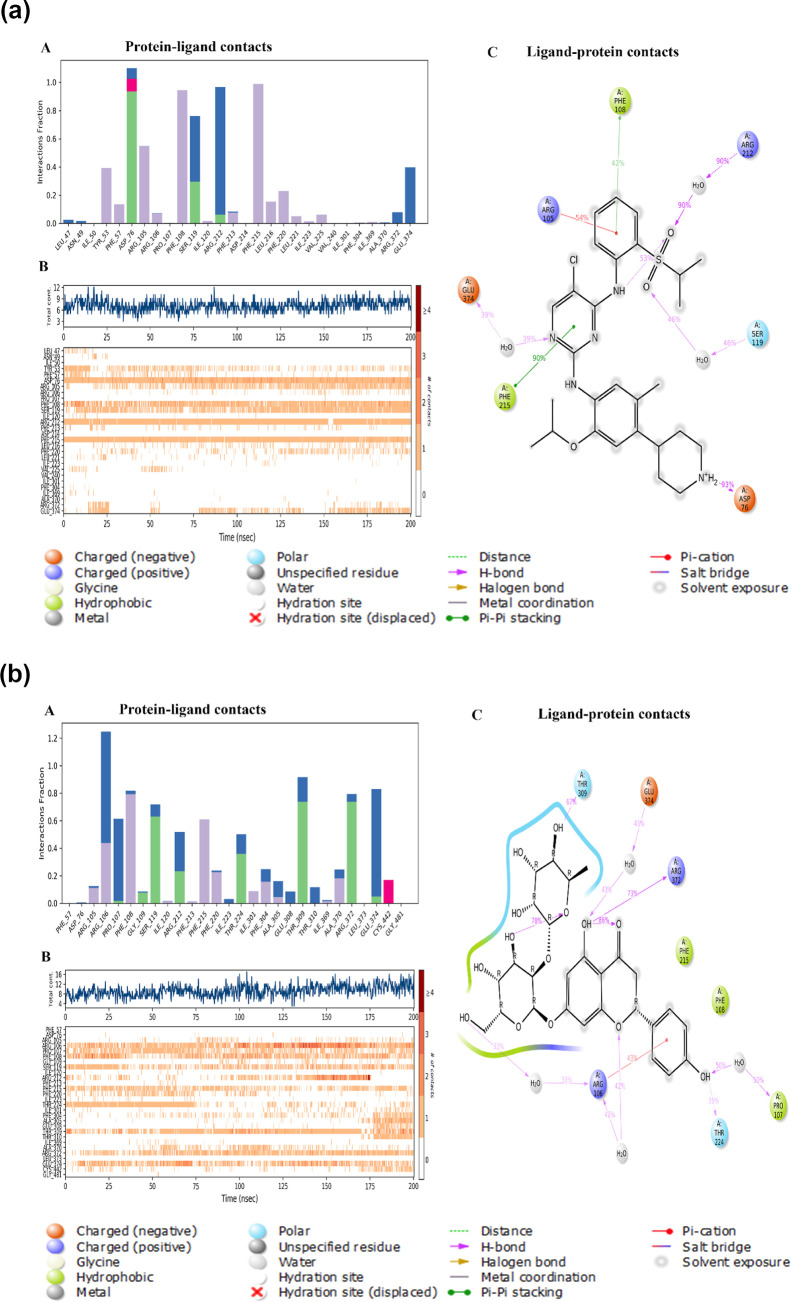
Figure 3.
(a) Figures illustrating protein–ligand interactions between CRT and CYP3A4 derived from MD simulation. (A) Graph showing the frequency of various protein–ligand interactions between CRT and various CYP3A4 amino acids. (B) Time line depicting the interactions between CYP3A4 and CRT (H-bond contacts and interactions shown vs time). (C) A two-dimensional ligand interaction map shows interactions that happen for over 30 percent of the 200 ns simulation time; the purple color arrow indicates a hydrogen bond with amino acids (for an explanation of the color references in this figure legend, the reader is referred to the article’s online version). (b) Figures illustrating protein–ligand interactions between NRG and CYP3A4 derived from MD simulation. (A) Graph showing the frequency of various protein–ligand interactions between NRG and various CYP3A4 amino acids. (B) Time line depicting the interactions between CYP3A4 and NRG (H-bond contacts and interactions shown vs time). (C) A two-dimensional ligand interaction map shows interactions that happen for over 50 percent of the 200 ns simulation time; the purple color arrow indicates a hydrogen bond with amino acids (for an explanation of the color references in this figure legend, the reader is referred to the article’s online version).

